


20090601
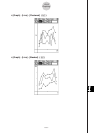
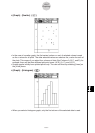
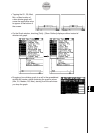
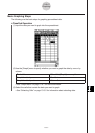
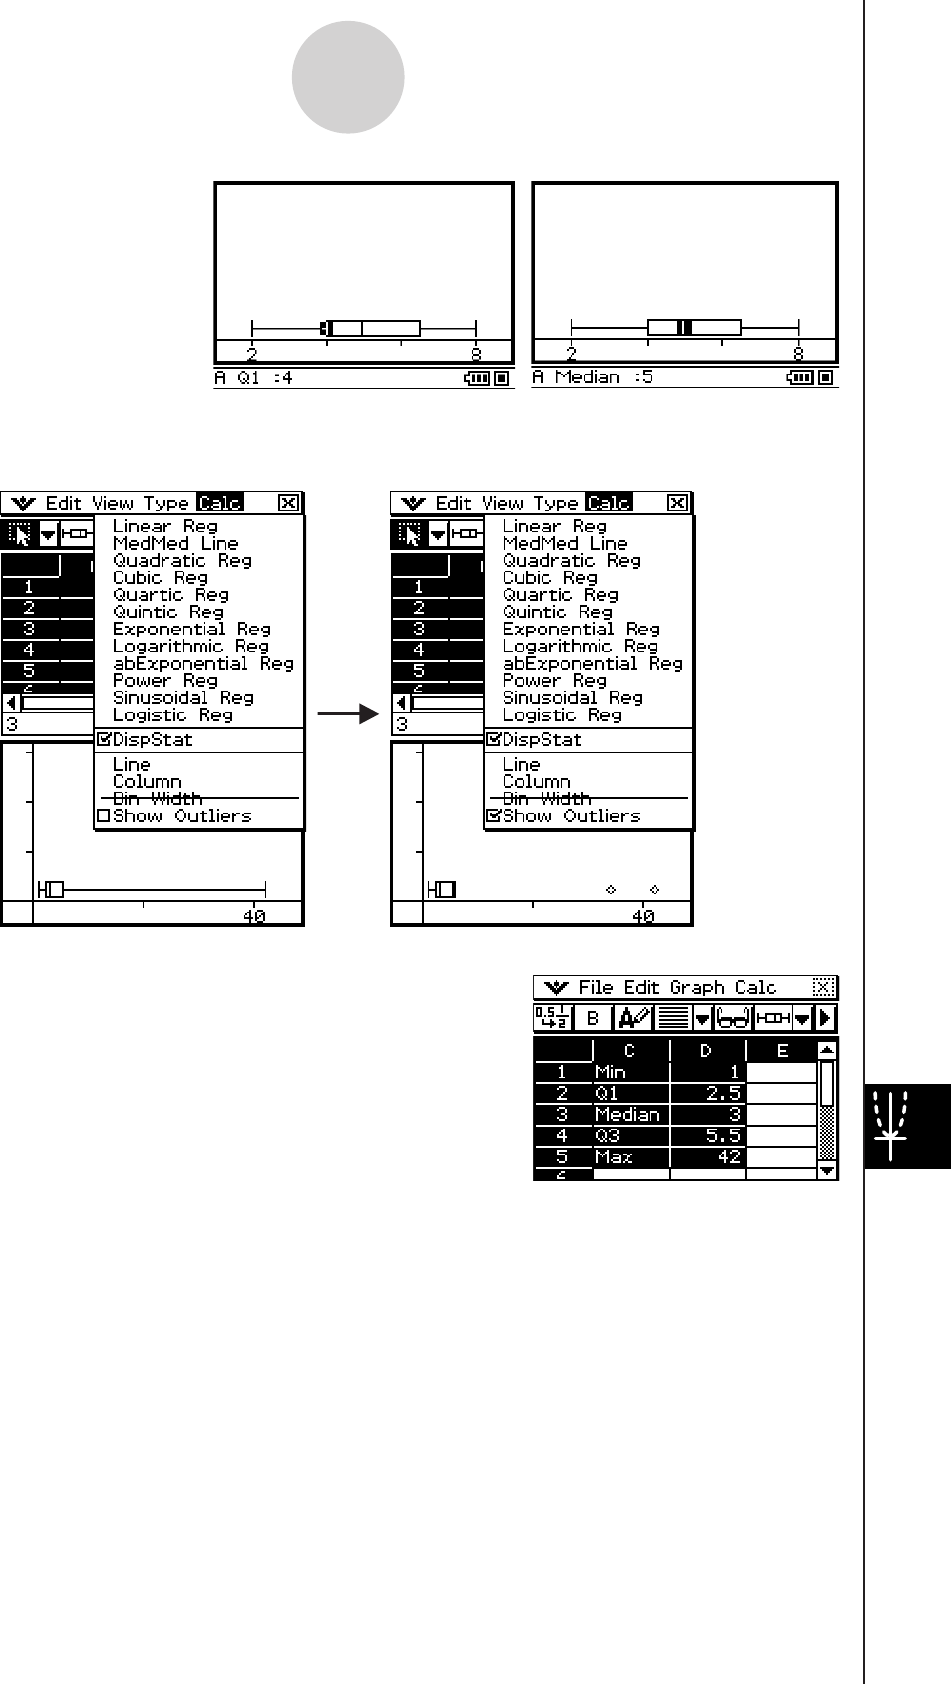
• Tapping the Q1, Q3, Med,
Min, or Max location of
a box whisker graph will
cause the applicable value
to appear at the bottom of
the screen.
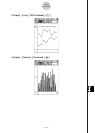
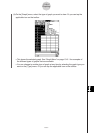
• On the Graph window, checking [Calc] - [Show Outliers] displays outliers instead of
whiskers on graph.
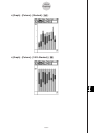
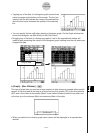
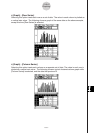
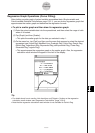
• Dragging a box whisker graph to a cell in the spreadsheet
window will create a table containing the graph’s values
(Min, Q1, Median, Q3, Max), starting from the cell where
you drop the graph.
13-9-9
Graphing