


3
3-4
Departmental Switch Models DS-16B and DS-8B Web Tools User Guide
Using Web Tools
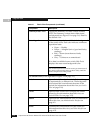
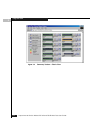
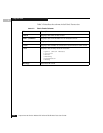
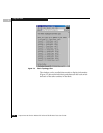
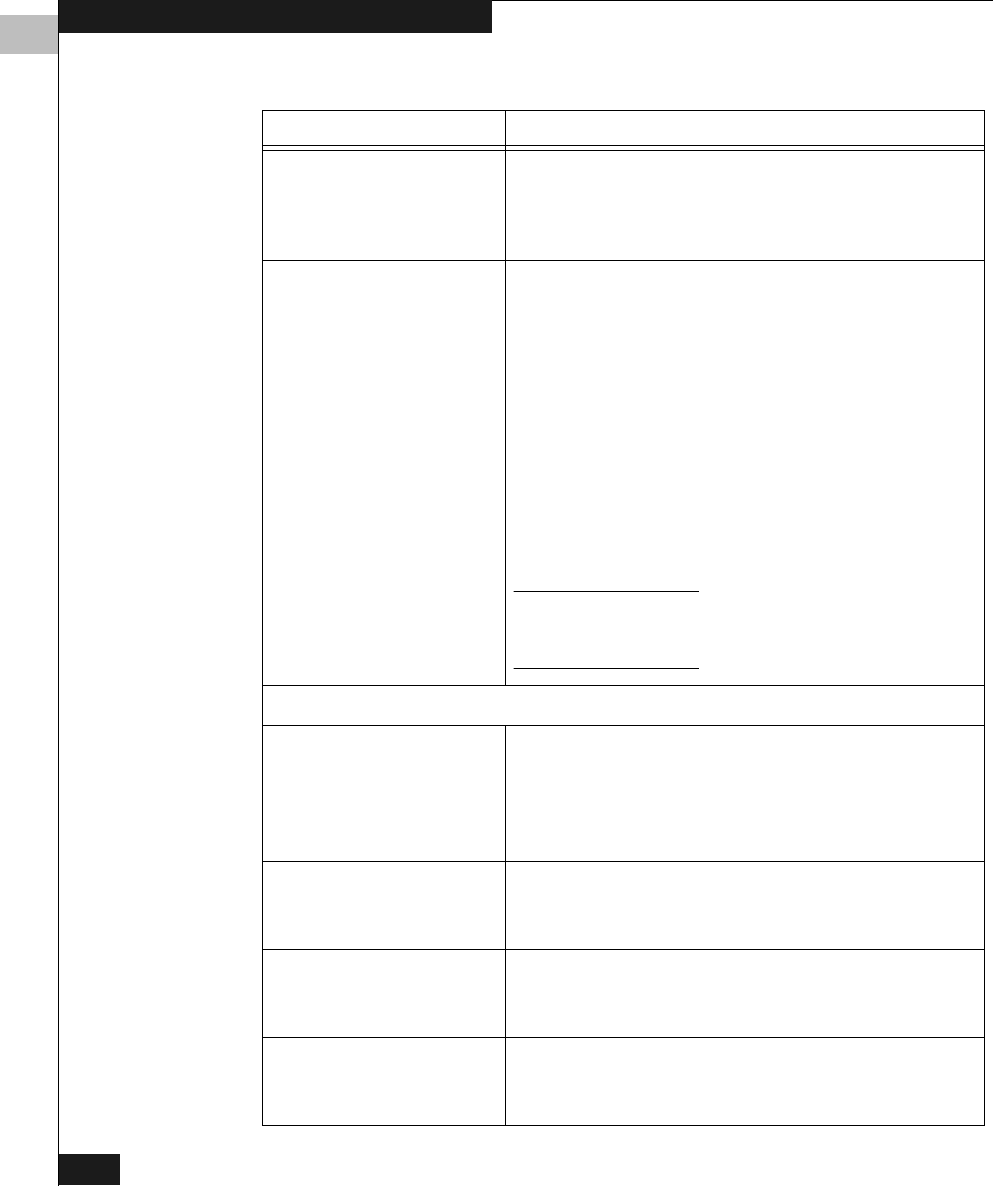
Summary/Detail View Toggles the Summary or Detail version of Fabric
View. The Summary version shows abbreviated
switch panels (see Figure 3-2 on page 3-6). Detail is
the default view.
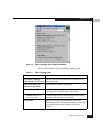
Status legend Defines meaning of colors visible in the background
of the switch icons. Each color indicates a different
operational state:
• Green — Healthy
• Yellow — Marginal (mix of good and faulty
readings)
• Red — Down (more than two faulty
readings)
• Gray — Unknown or unmonitored
If no data is available from a switch, Web Tools
displays the most recent background color.
For all statuses that are based on errors per time interval,
any errors will cause the status to show faulty until the
entire sample interval has passed.
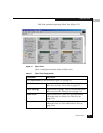
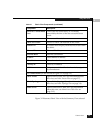
The Switch Panel (on the right side of Figure 3-1 on page 3-3.)
Switch Opens Switch View for the switch. Each switch type
is represented by a different icon. The background
color around the icon indicates the status of the
switch (for information about this view, see Switch
View on page 3-29).
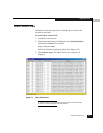
Events Opens Switch Events View to display the switch
events log (for information about this view, see
Switch Events View on page 3-33).
Admin Opens Switch Administration View (for information
about this view, see Administrative Interface on
page 4-2.
Te ln e t Launches the Telnet Interface for the switch (for
information about this view, see Telnet Interface on
page 4-23.
Table 3-1 Fabric View Components (continued)
Component Description