TI-83 Plus Function Graphing 110
•
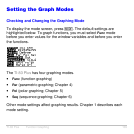
Float
or
0123456789
(fixed) decimal mode affects displayed graph
coordinates.
•
Radian
or
Degree
angle mode affects interpretation of some functions.
•
Connected
or
Dot
plotting mode affects plotting of selected functions.
•
Sequential
or
Simul
graphing-order mode affects function plotting
when more than one function is selected.
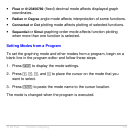
Setting Modes from a Program
To set the graphing mode and other modes from a program, begin on a
blank line in the program editor and follow these steps.
1. Press
z
to display the mode settings.
2. Press
†
,
~
,
|
, and
}
to place the cursor on the mode that you
want to select.
3. Press
Í
to paste the mode name to the cursor location.
The mode is changed when the program is executed.


