TI-83 Plus Tables 209
Displaying the Table
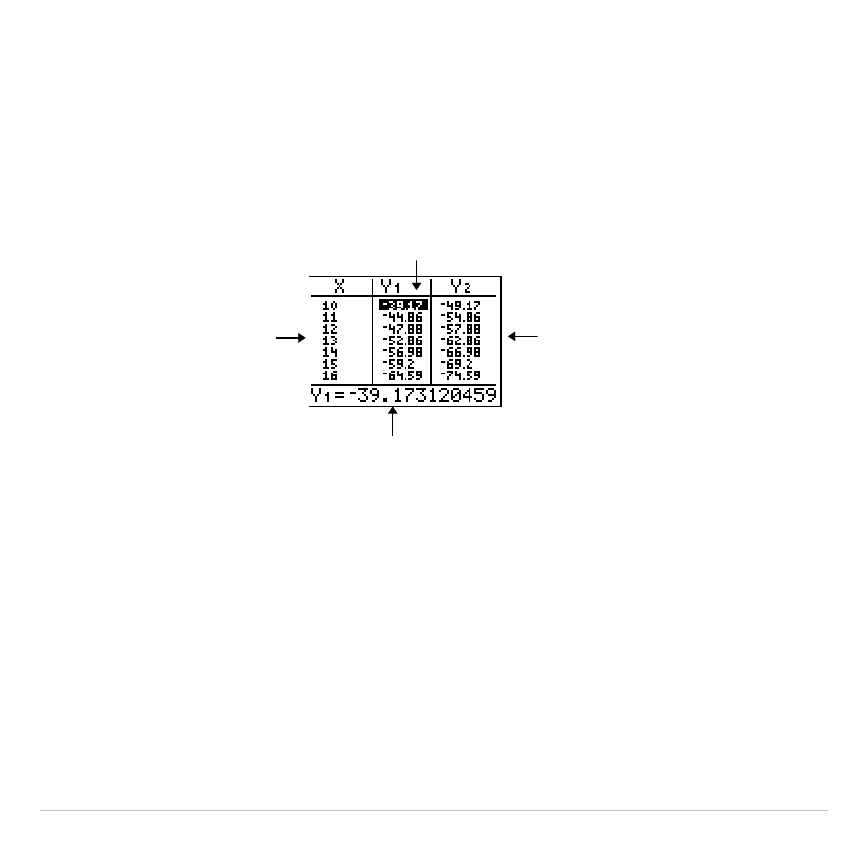
The Table
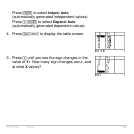
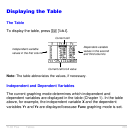
To display the table, press
y
0
.
Current cell
Independent-variable
values in the first column
Dependent-variable
values in the second
and third columns
Current cell’s full value
Note: The table abbreviates the values, if necessary.
Independent and Dependent Variables
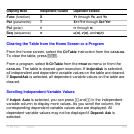
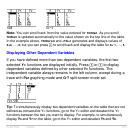
The current graphing mode determines which independent and
dependent variables are displayed in the table (Chapter 1). In the table
above, for example, the independent variable
X
and the dependent
variables
Y
1
and
Y
2
are displayed because
Func
graphing mode is set.


