


Making Measurements 3
N9340A User’s Guide 41
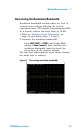
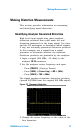
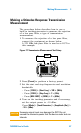
and the analyzer input.
2 Set one source (signal generator) to 300 MHz
and the other source to 301 MHz, for a
frequency separation of 1 MHz. Set the sources
equal in amplitude as measured by the analyzer
(in this example, they are set to –5 dBm).
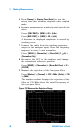
3 Set the analyzer center frequency and span:
• Press [PRESET]. (With Preset Type of Default)
• Press [FREQ] > {Center Freq} > 300.5 > {MHz}.
• Press [SPAN] > 5 > {MHz}.
4 Reduce the RBW until the distortion products
are visible:
• Press [BW/SWP] > {RBW}, and reduce the RBW
using the knob, the arrow keys or the numeric
keypad.
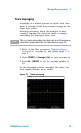
5 Move the signal to the reference level:
• Press [MARKER] > {Peak Search}.
• Press [MARKER] > {Marker To} > {To Ref}.
6 Reduce the RBW until the distortion products
are visible:
• Press [BW/SWP] > {RBW}, and reduce the RBW
using the knob, the arrow keys or the numeric
keypad.
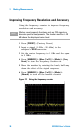
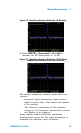
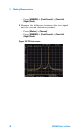
7 Activate the second marker and place it on the
peak of the distortion product (beside the test
signal) using the Next Peak:
• Press [MARKER] > {Delta}.
• Press [MARKER] > {Peak Search} > {Next Left
(Right) PK}.
8 Measure the other distortion product:
• Press [MARKER] > {Normal}.
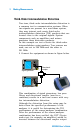
NOTE
The coupler should have a high degree of isolation
between the two input ports so the sources do not
intermodulate.