


Chapter 1
5 Avaya C360 SMON User Guide
Switch Statistics Overview
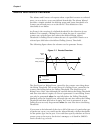
The Switch Statistics tool provides details of the traffic passing through
the switch fabric and allows you to detect problems on the switch. Once a
problem has been detected, you can use VLAN or Port Statistics to
determine more precisely the cause of the problem.
The display includes two sections:
• Pie charts and gauges showing traffic breakdown.
• A traffic graph that describes the characteristics of the traffic
passing through the device.
You can use the Switch Statistics tool for the following purposes:
• Gaining an overall view of the switched traffic over a specific time
period. This can help in discovering problems and analyzing traffic
trends.
• Discovering whether the device is being utilized efficiently or not.
• Monitoring the load distribution among switches.
• Detecting a large number of broadcast messages sent. This indicates
there may be a problem with a station on the network.
• Treating any variable with abnormal behavior as an issue that
should be investigated further using other SMON tools.
In general, the Switch Statistics tool can help you spot problems that only
become apparent from a high-level view over time. By periodically
viewing Switch Statistics, you can detect normal and abnormal behavior
of the specific switch configuration.
SMON collects and displays all information in real-time. In addition,
information collected during a session can be saved in a report.
Port Statistics Overview
The Port Statistics tool measures the traffic travelling through each port
on the selected device. For each port, SMON summarizes the traffic, such
as packets into the device and packets from the device. You can sort by
port name or by any of the packet types. You can see, for example, the
ports generating the most errors.
If you notice that a particular port displays a disproportionate amount of
errors, this may suggest that a device connected to the port is responsible
for the problem.