


Avaya C360 SMON User Guide 18
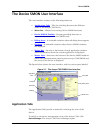
Switch Statistics
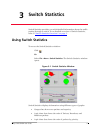
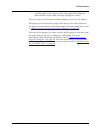
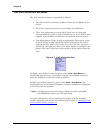
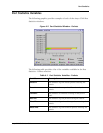
• A traffic graph section that contains line graphs describing the
characteristics of the traffic traveling through the switch.
The title of the Switch Statistics window displays the Device IP Address.
The gauges, pie charts and bar graph show data for the time furthest to
the right currently visible on the traffic graph. For more information, refer
to “
Traffic Graph in the Switch Statistics Window” on page 20.
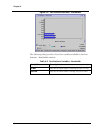
You can use the gauges, pie charts, and the traffic graph to view data from
an earlier point in time by scrolling the traffic graph. For more
information about modifying the display, refer to “
Using the General
Options Dialog Box” on page 58. For more information on the available
toolbar, status bar, and mouse movement options, refer to “
Working with
Device SMON Tools” on page 14.