


Avaya C360 SMON User Guide 26
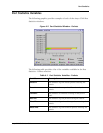
Port Statistics
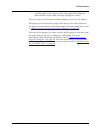
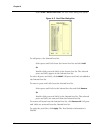
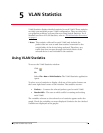
Figure 4-4. Port Statistics Window- Utilization
The following table provides a list of the variables available in the Port
Statistics - Utilization window.
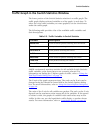
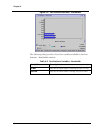
Selecting Ports to Display
By default, information from all ports and LAGs is displayed in the Port
Statistics window. You can limit information being displayed to specific
ports using Port, VLAN, and TopN filters. In addition, you can sort the
display. For information on sorting the display, refer to “
Sorting the
Display” on page 30.
Port
Filtering
You can filter the ports and LAGs displayed in the Port Statistics window.
Only selected ports are displayed in the Port Statistics window. This makes
it easier to concentrate on specific ports and LAGs in the network.
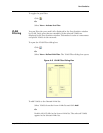
To open the port Filter dialog box:
Click .
Or
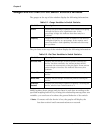
Table 4-3. Port Statistics Variables - Utilization
Variable Description
Util The percentage of the port or LAG’s capacity
currently being utilized.