


Avaya C360 SMON User Guide 62
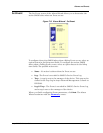
Avaya C360 SMON Dialog Boxes
Samples Per Screen
The Samples Per Screen option enables you to configure the number of
samples visible in the Traffic Graph. To change the number of samples
visible on the screen, enter a number in the
Samples Per Screen field.
* Note: The number of samples per screen must be between 3 and
500.
Samples To Store
The Samples To Store option enables you to configure the number of
samples saved in the Traffic Graph. You can scroll the Traffic Graph to
view all of the saved samples. To change the number of stored samples,
enter a number in the
Samples To Store field.
* Note: The number of samples to store must be between 100 and
8000.
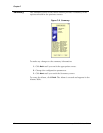
Logarithmic Display
The Logarithmic Display option enables you to specify whether or not you
want the Traffic Graph to be displayed on a logarithmic scale. This is
useful when the values in the graph are small.
To view the traffic graph with a logarithmic display, check the
Logarithmic
Display
checkbox.
To view the traffic graph with a non-logarithmic display, uncheck the
Logarithmic Display checkbox.
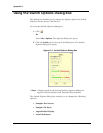
Level Indicators
The Level Indicators option enables you to change the appearance of the
gauges at the top of the Switch Statistics window. This allows you to
determine the range corresponding to the colors of the gauge.
To configure the level indicators, slide the markers for each of the gauges
to the desired percentages.
The leftmost marker sets the percentage at which the color on the gauge
changes from green to yellow. The rightmost marker sets the percentage
at which the color on the gauge changes from yellow to red.