


Chapter 6
39 Avaya C360 SMON User Guide
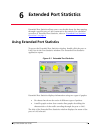
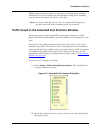
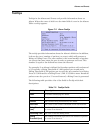
The following table provides a list of the statistics found in the Priority
Distribution pie chart:
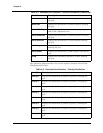
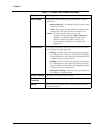
Bdcsts Pkts Displays the distribution of broadcast packets entering
the port.
Mcsts Pkts Displays the distribution of multicast packets entering
the port.
Bad In CRC Align Displays the distribution of packets entering the port
with a CRC Alignment error.
Bad In Undersize Displays the distribution of undersize packets entering
the port.
Bad In Oversize Displays the distribution of oversize packets entering
the port.
Bad In Fragments Displays the distribution of fragmented packets
entering the port.
Bad In Jabber Displays the distribution of jabber packets entering the
port.
In BW Displays the bandwidth utilization of traffic entering
the port.
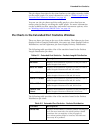
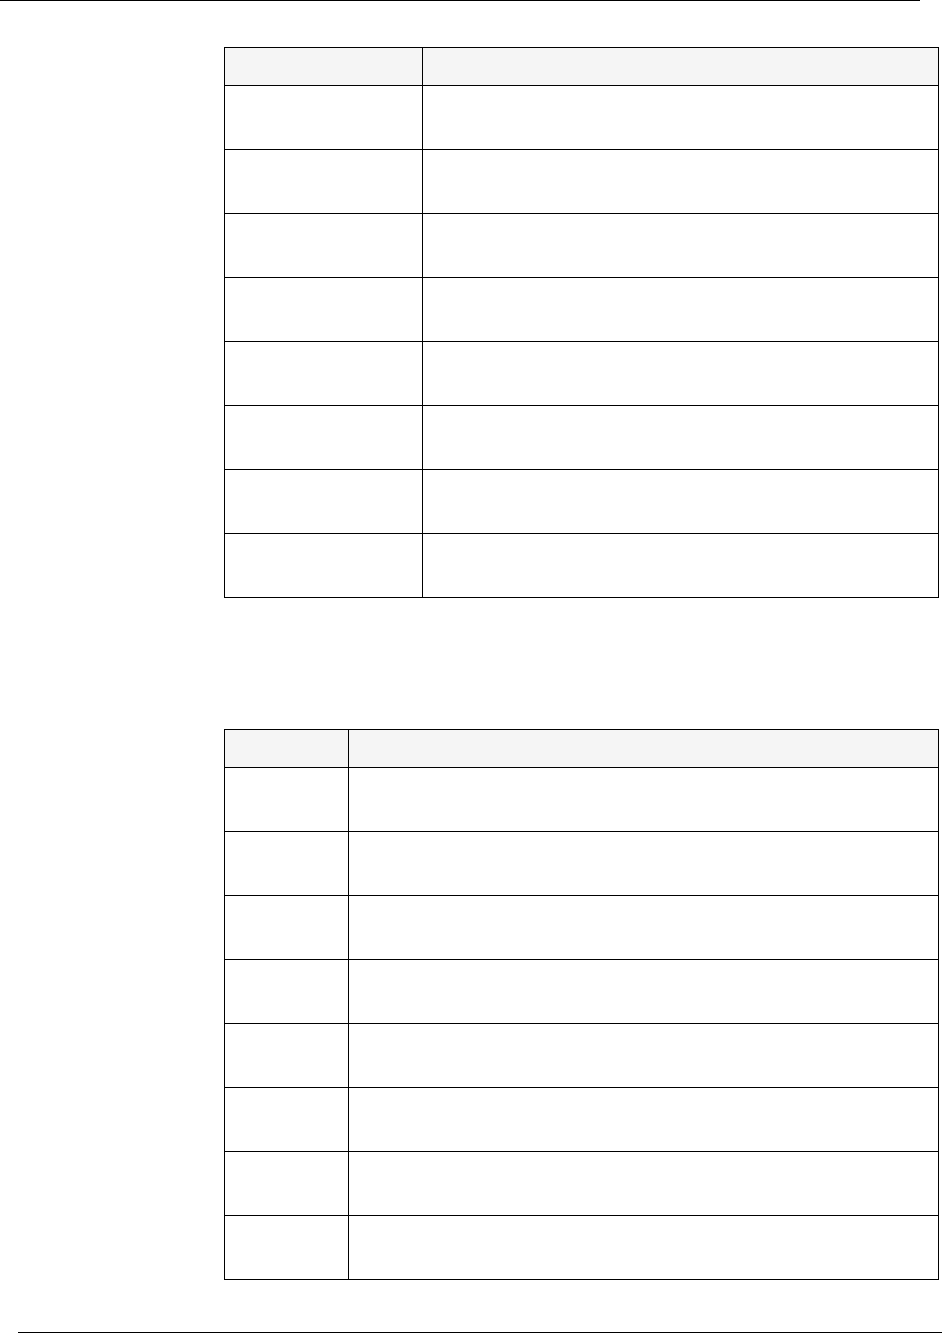
Table 6-3. Extended Port Statistics - Priority Distribution
Variable Description
Priority 0 Displays the distribution of packets of priority 0 entering the
port.
Priority 1 Displays the distribution of packets of priority 1 entering the
port.
Priority 2 Displays the distribution of packets of priority 2 entering the
port.
Priority 3 Displays the distribution of packets of priority 3 entering the
port.
Priority 4 Displays the distribution of packets of priority 4 entering the
port.
Priority 5 Displays the distribution of packets of priority 5 entering the
port.
Priority 6 Displays the distribution of packets of priority 6 entering the
port.
Priority 7 Displays the distribution of packets of priority 7 entering the
port.
Table 6-2. Extended Port Statistics - Packets Distribution (Continued)
Variable Description