


Avaya C360 SMON User Guide 38
Extended Port Statistics
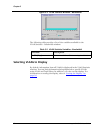
The pie charts show data for the time furthest to the right currently visible
on the traffic graph. For more information, refer to “
Traffic Graph in the
Extended Port Statistics Window” on page 40.
You can use the pie charts and the traffic graph to view data from an
earlier point in time by scrolling the traffic graph. For more information
on the available toolbar, status bar, and mouse movement options, refer
to “
Working with Device SMON Tools” on page 14.
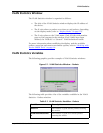
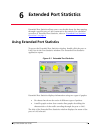
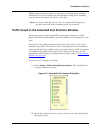
Pie Charts in the Extended Port Statistics Window
There are three pie charts at the top of the window. The leftmost pie chart
displays Packets Length Distribution, the center pie chart displays Packets
Distribution, and the rightmost pie chart displays Priority Distribution.
The following table provides a list of the statistics found in the Packets
Length Distribution pie chart:
The following table provides a list of the statistics found in the Packets
Distribution pie chart:
Table 6-1. Extended Port Statistics - Packets Length Distribution
Variable Description
64 Octets Displays the distribution of packets on the port with a
packet length of 64 octets.
65 to 127 Octets Displays the distribution of packets on the port with a
packet length of between 65 and 127 octets.
128 to 255 Octets Displays the distribution of packets on the port with a
packet length of between 128 and 255 octets.
256 to 511 Octets Displays the distribution of packets on the port with a
packet length of between 256 and 511 octets.
512 to 1023 Octets Displays the distribution of packets on the port with a
packet length of between 512 and 1023 octets.
1024 to 1518
Octets
Displays the distribution of packets on the port with a
packet length of between 1024 and 1518 octets.
Table 6-2. Extended Port Statistics - Packets Distribution
Variable Description
Uncsts Pkts Displays the distribution of unicast packets entering the
port. On most networks, the unicast packets should
constitute the vast majority of the pie graph. If
non-unicast packets begin to increase, this indicates
there may be a problem.