


Avaya C360 SMON User Guide 20
Switch Statistics
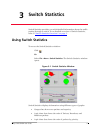
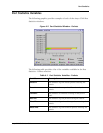
Traffic Graph in the Switch Statistics Window
The lower portion of the Switch Statistics window is a traffic graph. The
traffic graph displays selected variables as a line graph, in real-time. To
select the color coded variables you want graphed, use the check boxes
under the traffic graph.
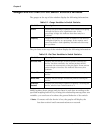
The following table provides a list of the available traffic variables and
their descriptions.
SMON continuously monitors statistics for all available Switch Statistics
traffic variables, even those that are not currently selected. For
information on finding the 5 highest peaks of traffic, refer to “
Using the
Find Top5 Peaks Dialog Box” on page 74.
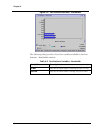
The X axis of the graph represents time. The scale on the X axis can be
changed using the
Samples Per Screen field in the Switch Options dialog
box. For more information, refer to
“Using the General Options Dialog Box”
on page 58.
The units of the Y axis for all variables are packets. The scale on the Y axis
depends on the maximum value among all of the variables. If the spread
of values is wide, the graphs of variables with small values may not be
visible. In this case, use the logarithmic traffic display to produce better
results. For more information, refer to
“Logarithmic Display” on page 62.
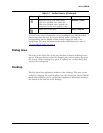
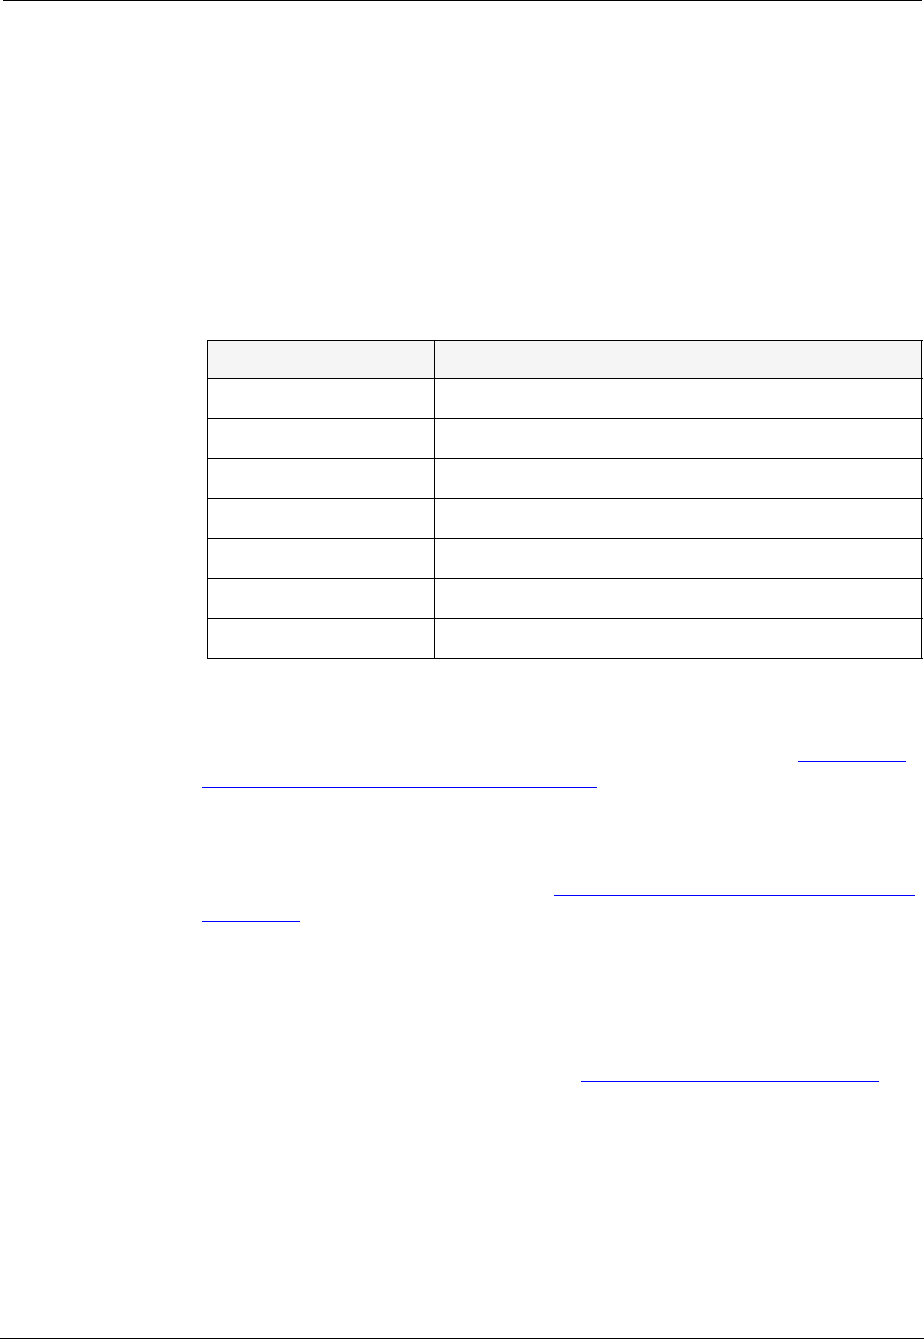
Table 3-3. Traffic Variables in Switch Statistics
Variable Description
Bdcsts Pkts Good broadcast packets entering into the switch.
Errors In Error packets entering the switch.
Good Pkts In Good packets traveling the switch.
In BW Total number of Kilobits entering the switch.
Mcsts Pkts Good multicast packets entering the switch.
TPkts Pkts Total packets entering the switch.
Uncsts Pkts Good unicast packets entering the switch.