Chapter 2
16 Avaya C360 Manager User Guide
Refreshing Device Information
You can refresh the information in the Avaya C360 Device Manager. To
refresh Avaya C360 device information, select
View > Refresh. The
Avaya C360 Device Manager refreshes its device information and updates
the display.
Using Dialog Boxes and Tables
Dialog boxes and tables in the Avaya C360 Manager application have a
common set of buttons. The following table displays the buttons and
explains their functions:
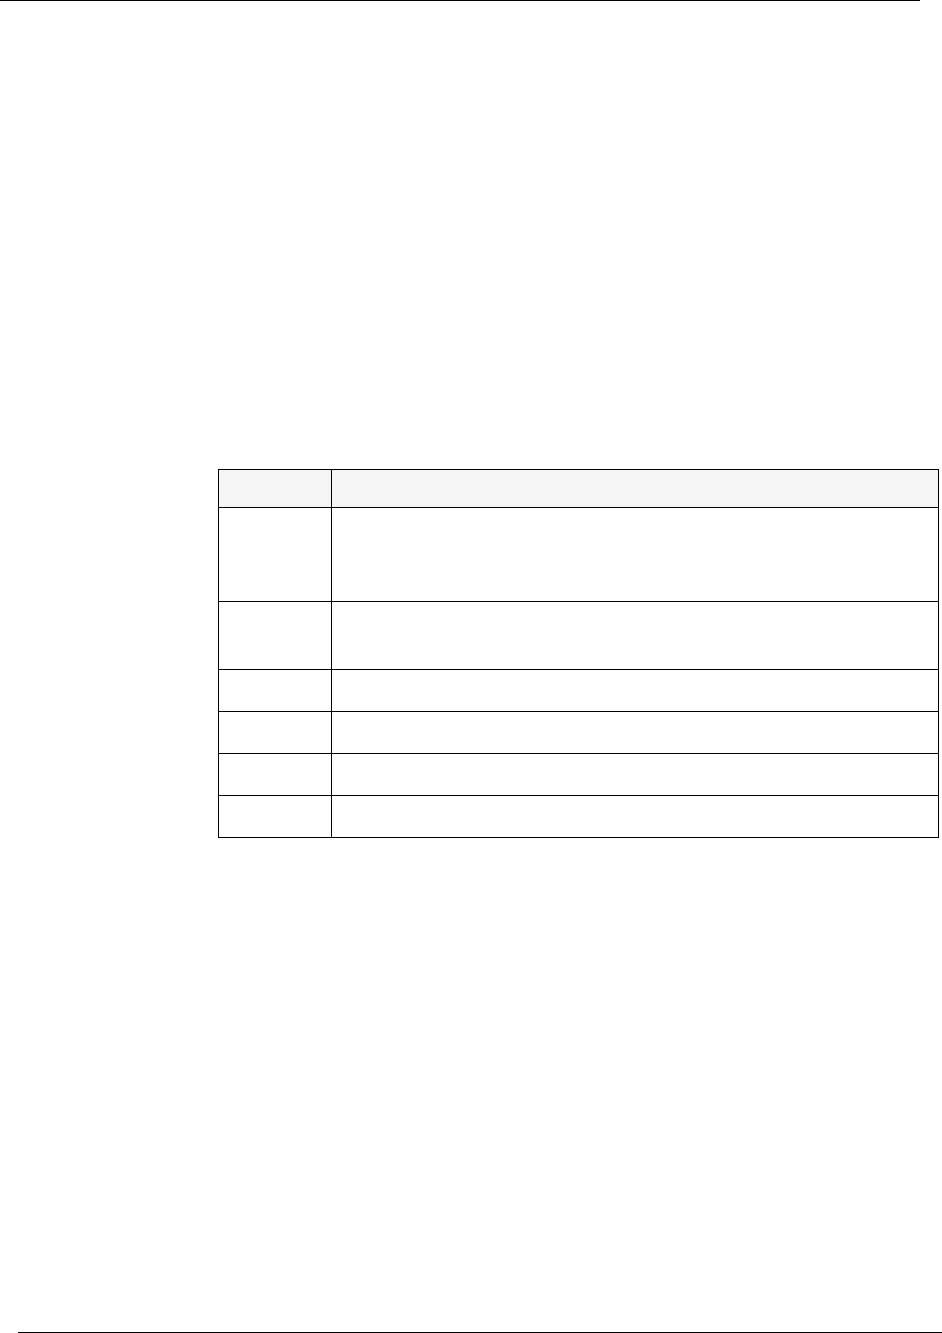
Table 2-5. Dialog Box Icons
Icon Function
Refresh
Refreshes the information in the table or dialog box. This
clears any changes made to the table or dialog box and not
yet sent to the device.
Apply
Sends the information from the table or dialog box to
update the device.
Insert
Adds a row to the table.
Wizard
Starts a wizard.
Delete
Deletes the selected rows of the table.
Undo
Undoes all changes to the selected row in a table.


