


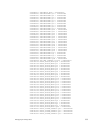
Version Description
8.3.19.0 Introduced on the S4820T.
8.3.11.0 Introduced on the Z9000.
8.3.7.0 Introduced on the S4810.
7.8.1.0 Introduced on the S-Series.
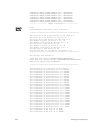
show hardware stack-unit
Display the data plane or management plane input and output statistics of the designated component of
the designated stack member.
Syntax
stack-unit <id> {cpu data-plane statistics | cpu management
statistics | [ drops [unit number [port 1-104] | user-port
0-127] | fpga register | party-bus statistics | stack-port |
ti-monitor | unit 0-1 {counters | details | port-stats [detail]
| register}}
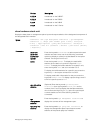
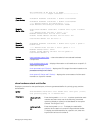
Parameters
stack-unit
stack-unit
{command-
option}
Enter the keywords stack-unit to select a particular stack
member and then enter one of the following command
options to display a collection of data based on the option
entered. The range is from 0 to 5.
buffer Enter the keyword buffer. To display the total buffer
statistics for the stack unit, enter the keyword
total-
buffer. To display the buffer statistics for a specific unit,
enter the keyword
unit and a unit number 0 or 3.
To display the buffer statistics for a specific port, enter the
keyword port and a port number from 1 to 104 .
To display total buffer information for the port, enter the
keywords buffer-info. To display a queue range, enter 0
to 14 for a specfic queue or
all.
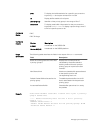
cpu data-plane
statistics
(Optional) Enter the keywords cpu data-plane
statistics
then the keywords stack port and its
number, from 0 to 63 to display the data plane statistics,
which shows the High Gig (Higig) port raw input/output
counter statistics to which the stacking module is
connected.
cpu
management
statistics
Enter the keywords cpu management statistics to
display the counters of the management port.
cpu party-bus
statistics
Enter the keywords cpu party-bus statistics, to
display the Management plane input/output counter
statistics of the pseudo party bus interface.
Debugging and Diagnostics
531