


xStack
®
DES-3200-10/18/28/28F Layer 2 Ethernet Managed Switch User Manual
Section 7
Monitoring
Cable Diagnostic
CPU Utilization
Port Utilization
Packet Size
Memory Utilization
Packets
Errors
Port Access Control
Browse ARP Table
Browse VLAN
IGMP Snooping
LLDP
MBA Authentication State
Browse Session Table
MAC Address Table
System Log
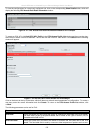
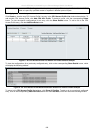
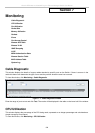
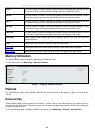
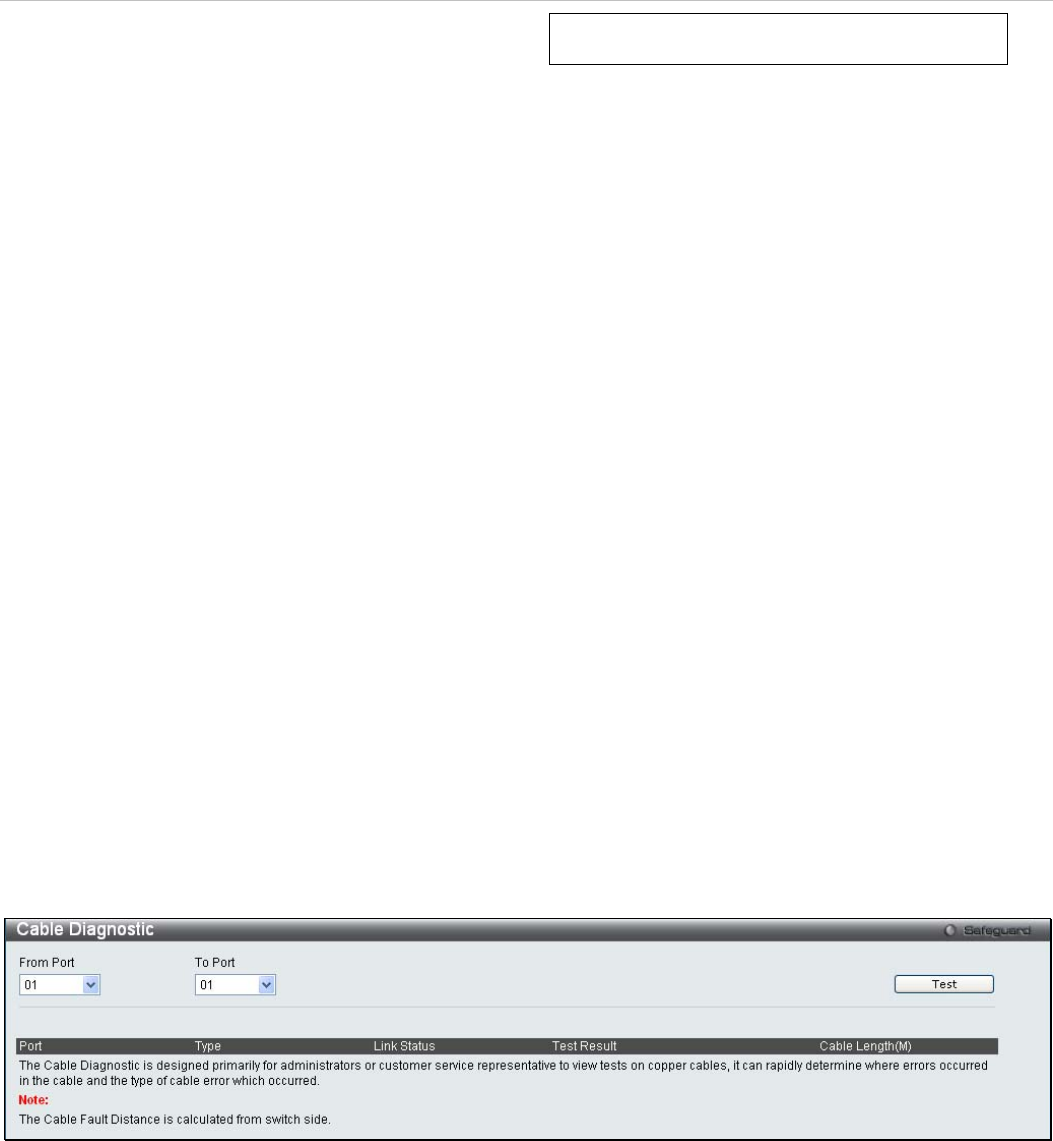
Cable Diagnostic
This window displays the details of copper cables attached to specific ports on the Switch. If there is an error in the
cable this feature can determine the type of error and the position where the error has occurred.
To view this window, click Monitoring > Cable Diagnostic:
Figure 7 - 1. Cable Diagnostic window
Enter the range of ports to test and click Test. The results will be displayed in the table on the lower half of the window.
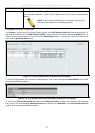
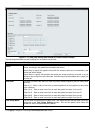
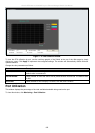
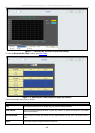
CPU Utilization
This window displays the percentage of the CPU being used, expressed as an integer percentage and calculated as a
simple average by time interval.
To view this window, click Monitoring > CPU Utilization:
184