


7-30 REPORTS
MON2000
View Live Trend Online Model 700/2350A JULY 2010
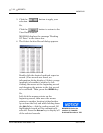
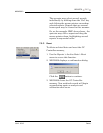
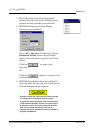
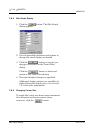
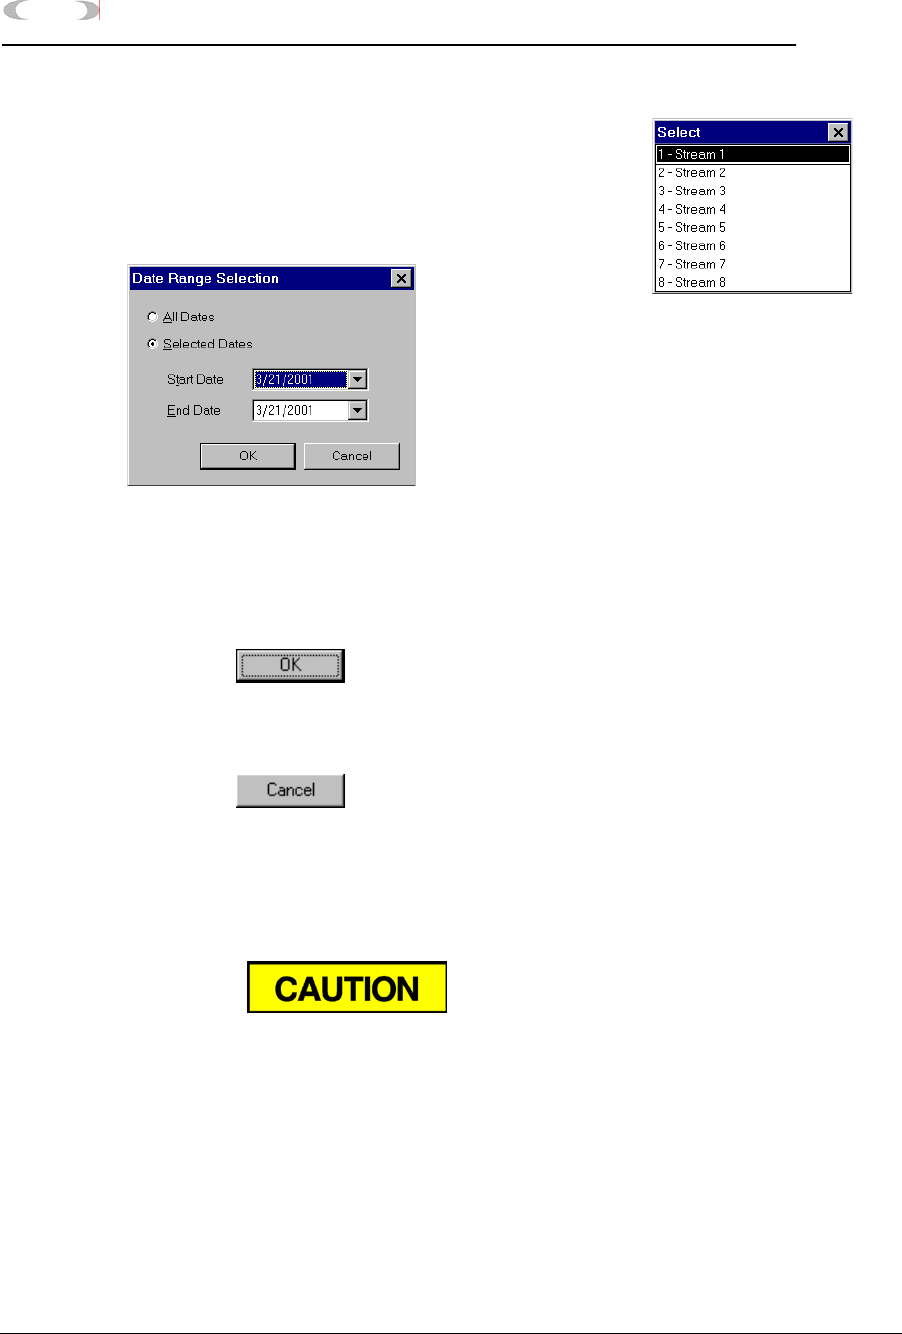
3. The Select menu for streams appears.
Double-click the left mouse button on the
desired stream to make your selection.
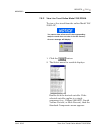
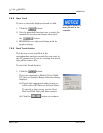
4. MON2000 displays the Date Range
Selection pop-up dialog.
Select All Dates radio button or choose
Selected Dates. From the pull-down
menu, select the date range for the Trend
report.
Click the to apply your
selection.
Or,
Click the button to return to the
trend window.
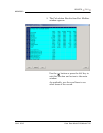
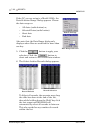
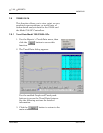
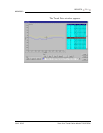
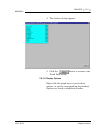
5. MON2000 reads data from the online GC
unit and plots the current, live trend for the
selected component and stream.
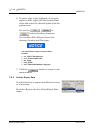
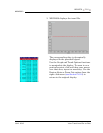
Plotting a trend line interrupts the normal storage
of ongoing Auto Sequence analysis results.
A trend line graph generated from the maximum
1200 archived analysis records can require up to
8 minutes to plot. Any Auto Sequence analysis
that occurs during the plotting will not be
retained for future retrieval nor will be included in
ongoing calculations.