


Back to TOC Scanning from HP Precisionscan Pro 55
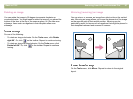
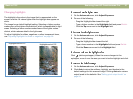
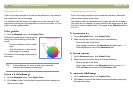
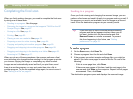
Viewing RGB values and pixels
You can view the RGB values and pixel color for any spot in a color or
grayscale image using the RGB meter.
To view the RGB values and pixel color for slides, negatives, or other
transparent items, use "Viewing RGB values and pixel color" on
page 85.
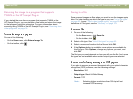
1 On the Advanced menu, click Adjust Exposure.
2 Move the pointer over the image. The RGB values and pixel color
appear in the RGB meter.
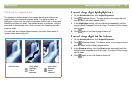
Note: Do not click while the eyedropper pointer is over the
image unless you want to change the setting for
highlight or shadow.
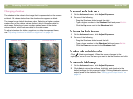
3 Click the same eyedropper button again. The RGB meter dims and
the cursor returns to normal.
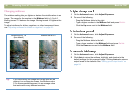
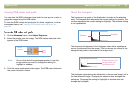
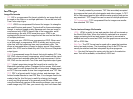
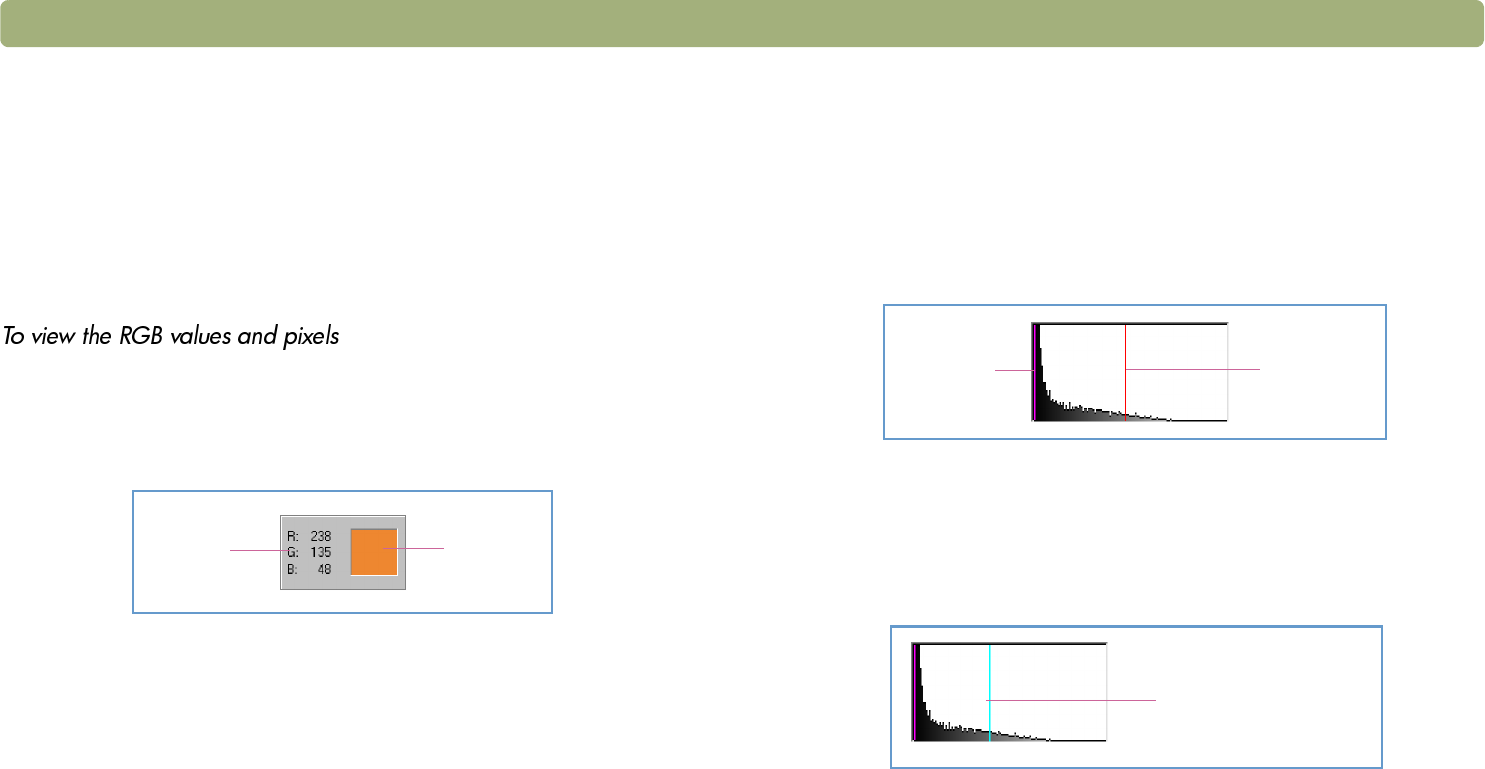
About the histogram
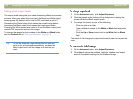
The histogram is a graph of the distribution of pixels in the selection
area. The magenta line represents the current setting for shadow. The
red line represents the current setting for highlight. The midtone setting
is not represented.
The turquoise line appears in the histogram when either eyedropper
cursor is positioned over the image. This line shows you where in the
histogram the pixels in that area of the image occur.
The histogram represents pixel distribution in the preview image, not in
the final scanned image. Changing the selection area changes the
histogram. Changing the setting for highlight or shadow does not
change the histogram.
RGB
values
Pixel
color
Shadow
Highlight
Where pixels in the
image under the
eyedropper fall