Director
7
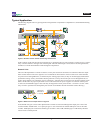
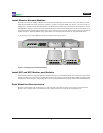
In this installation, Director has ten additional Span ports and one in-line link that are available for expansion, when
more links need to be monitored.
Monitoring Tools
Still referring to Figure 2, six monitoring tools are connected to Director. They include protocol and performance analyzers,
RMON probes, and an intrusion detection system (IDS). Any of the monitoring tools can be used to observe any of the
connected network links, and the connections can be switched easily, using the Director CLI, without ever moving a
cable or touching the tools. A set of possible data ows is indicated by the colored circles on the links in the diagram.
One of the network monitoring tools is capable of handling more than 1 Gbps, so it is attached to a 10 Gigabit XFP
port. Through this port, the tool can be sent aggregated trafc up to 10 Gbps. For example, the colored circles in the
diagram indicate that trafc from four links is being aggregated and sent to this port.
Four streams of trafc are also being aggregated to the red monitoring tool on the upper left. Since this is a 1 Gbps Monitor
port, aggregated data up to 1 Gbps can be sent to the red tool. If the aggregated trafc exceeds 1 Gbps, packets will be
dropped. To avoid dropping packets, lters should be congured to reduce the aggregated trafc load to 1 Gbps or less.
The two green RMON monitoring tools at the bottom are the same type of tool. Two identical tools provide the capabil-
ity of monitoring a greater amount of data than a single tool can handle. Another reason to use identical monitoring
tools is to provide redundancy in case one of the tools fails. In addition, Director can be congured to send different
types of trafc to each tool, for example, all the TCP trafc to one tool, and the UDP trafc to the other.


