


Patterns and Relations
Activity 4: Stadium Walls
17
© 1998 T
EXAS
I
NSTRUMENTS
I
NCORPORATED
10. Ask:
What remains the same or constant? (1)
What changes or varies? (L-number of lengths varies)
What will the graph of the line represented by these
equations look like?
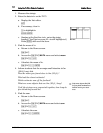
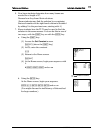
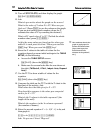
11. The TI-73 uses X and Y when graphing, so change the
equation B = 3L + 1 to Y = 3X + 1 using the Y= editor.
a. On each line where there is an entry, clear the
Y= editor.
& :
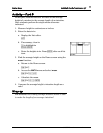
b. Now enter the equation.
[ I \ Y
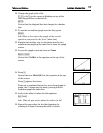
12. View the window.
'
13. Discuss the possible values for X and Y. Ask questions
such as:
What does X represent? (length)
Do you need negative values for Xmin? (no)
What would you suggest for Xmin? (Look at T-chart
data.)
What do you suggest for Xmax?
What does Y represent? (number of beams)
Do you need negative values for Ymin?
What do you suggest for Ymin? (Look at T-chart
data.)
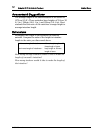
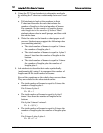
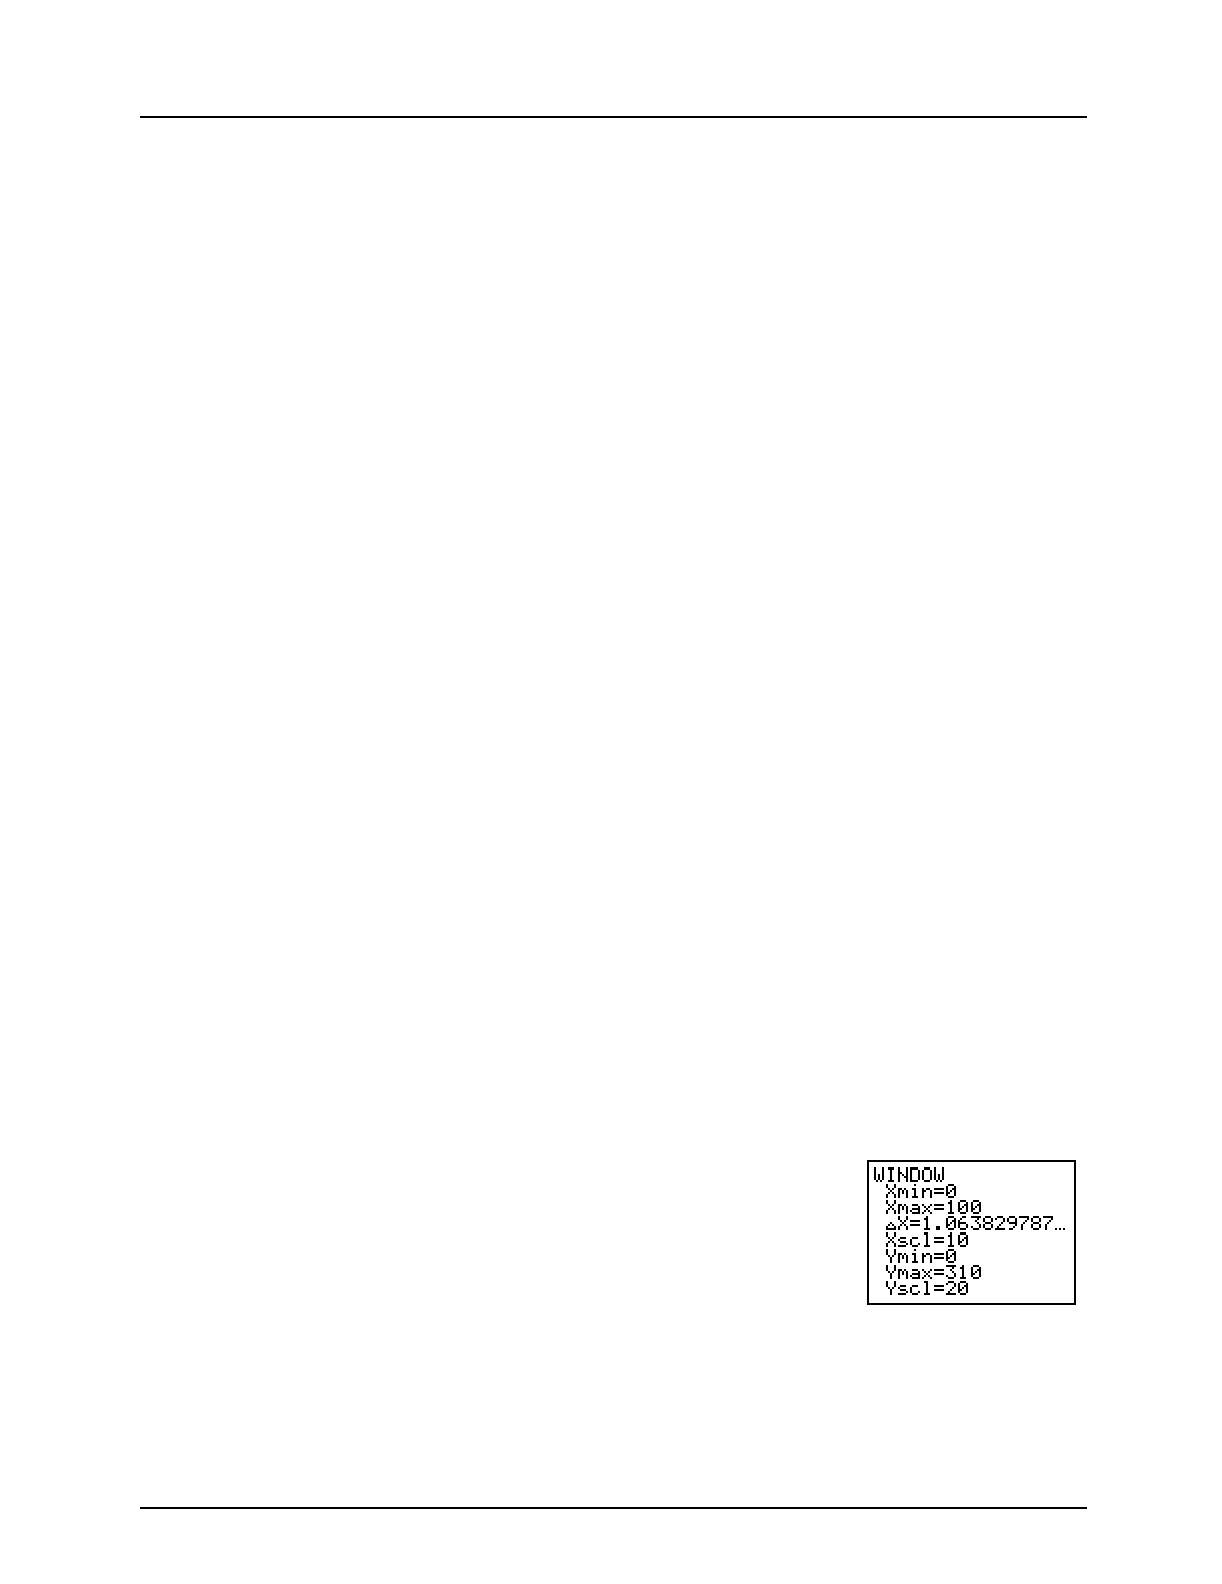
What do you suggest for Ymax? Should it be smaller
or larger than Xmax?
At the right is an example of an appropriate window.