


Patterns and Relations
Activity 4: Stadium Walls
19
© 1998 T
EXAS
I
NSTRUMENTS
I
NCORPORATED
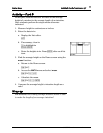
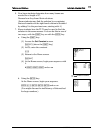
20. Change the graph style of
Y
2
.
& # to
Y
2
! so the cursor is blinking on top of the
little diagonal line on the far left
b
Notice that the diagonal line has changed to a darker
line.
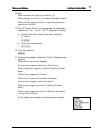
21. To see the second line graph over the first, press
*.
Ask: What is true about the graph of the second
equation compared to the first? (same line)
22. Explain that another way to determine that the two
equations are graphing the same line is from the graph
screen.
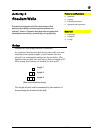
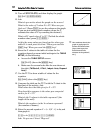
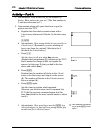
23. Access the graph screen and turn on
Trace
.
* )
Notice that
Y1=3X+1
is the equation at the top of the
screen.
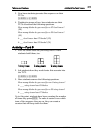
24. Press $.
Notice that now
Y2=4+3(X-1)
is the equation at the top
of the screen.
Press $ again a few times.
Point out to students that as they move from graph to
graph, the Y values stay the same, proving that the
equations graph the same line.
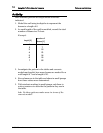
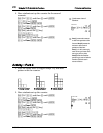
25. Look at the table of values for this equation.
- i
Ask: What do you notice about the values in
Y
2
?
26. Repeat the procedure for the third equation by
entering it in
Y
3
and viewing the table of values.