


Measurement and Geometry
Activity 8: Drip, Drip, Drip
43
© 1998 T
EXAS
I
NSTRUMENTS
I
NCORPORATED
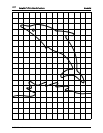
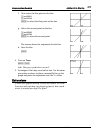
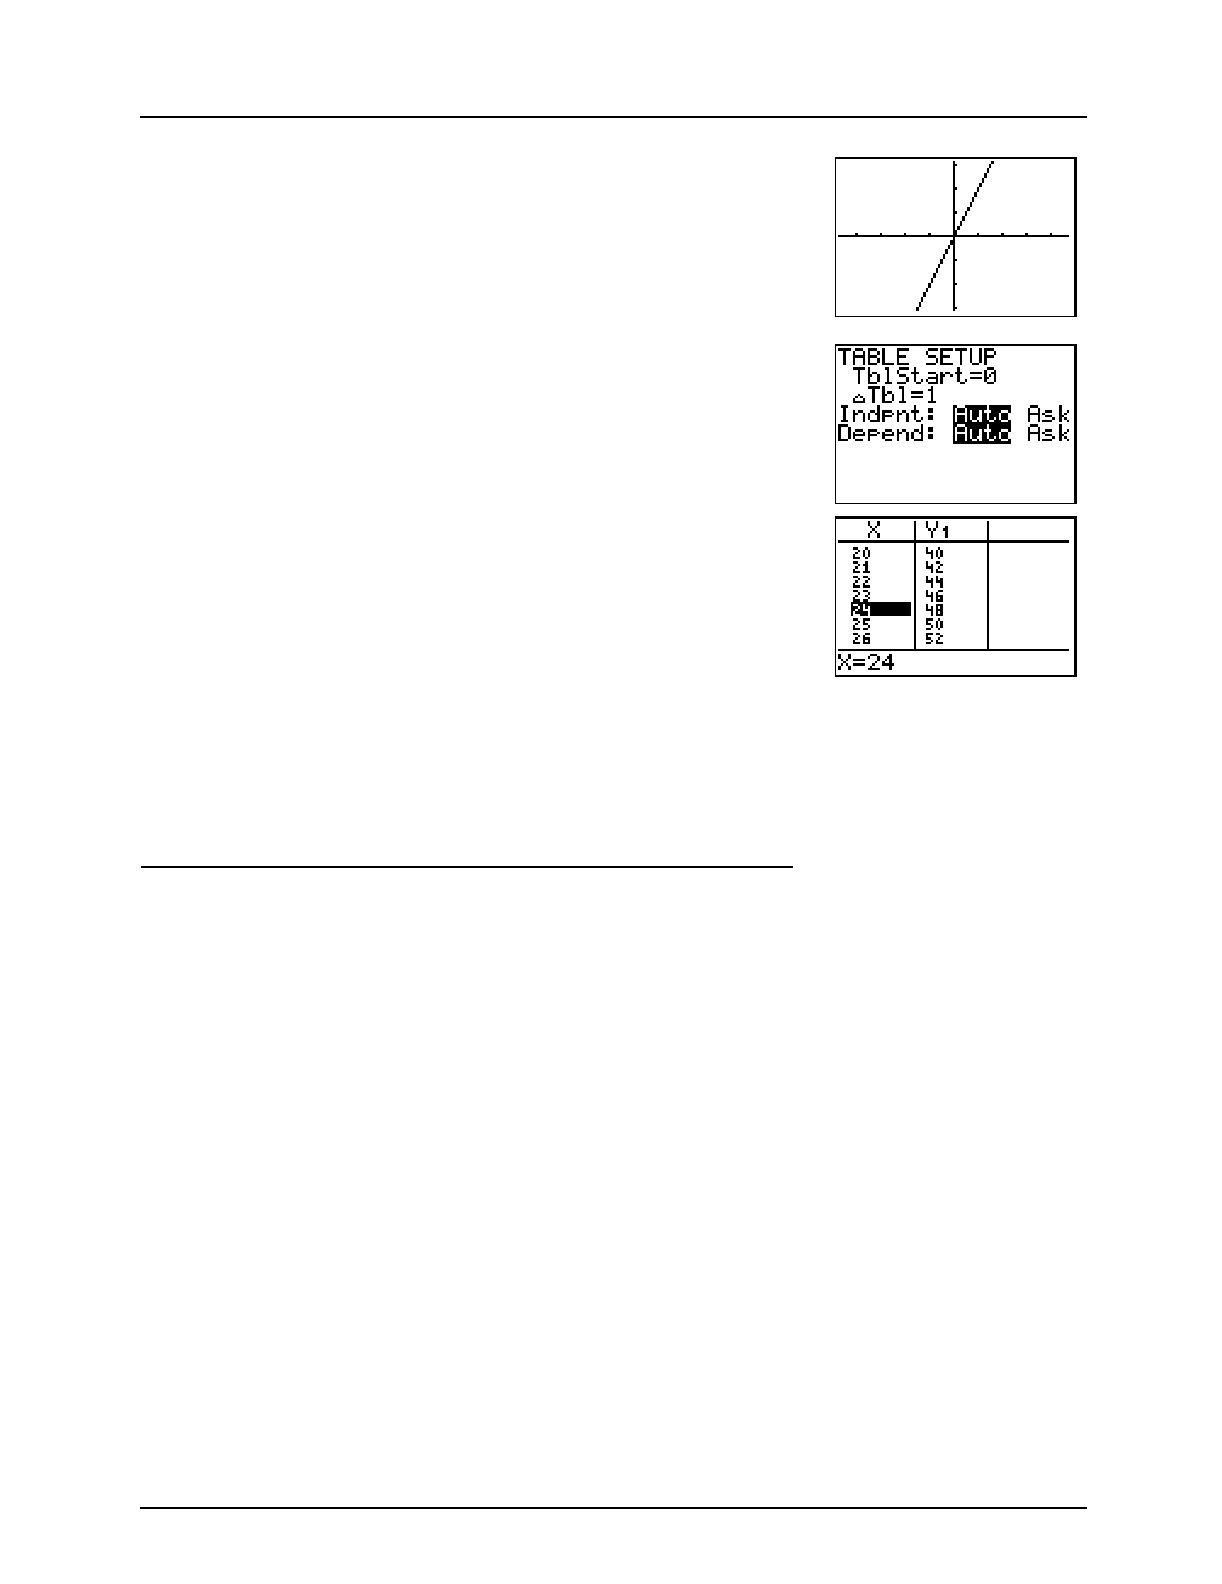
11. View and trace the graph.
* )
! or " to trace until
X=0
Ask: What is the value of Y? What does this point
represent? (When time = 0, there is no water.)
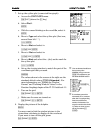
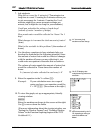
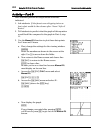
12. Now look at this same information in a table.
- f (above the ' key)
The screen should look like the one at the right.
- i (above the * key)
13. Scroll down (#) in the
X
column to
24
.
Ask:
What is in the
Y
1
column?
What does this value mean?
Is this the same amount of water that you calculated
on the Home screen for 1 day?
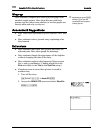
➪
If you want to go directly
to X=24, set your table
start (
TblStart
) to 24 on
the
TABLE SETUP
screen
(
-
f
).
Wrap-up for Part A
♦ Using the table, have students answer these questions.
How much water would be wasted if the drip
continued over a weekend?
How much water would be wasted over the Christmas
holiday?
How much water would be wasted in a year?
How long would it take to fill our classroom with
water?
♦ Make sure students have completed their activity
sheets.