74
Using the TI-73: A Guide for Teachers
Pr
obability and Statistics
© 1998 T
EXAS
I
NSTRUMENTS
I
NCORPORATED
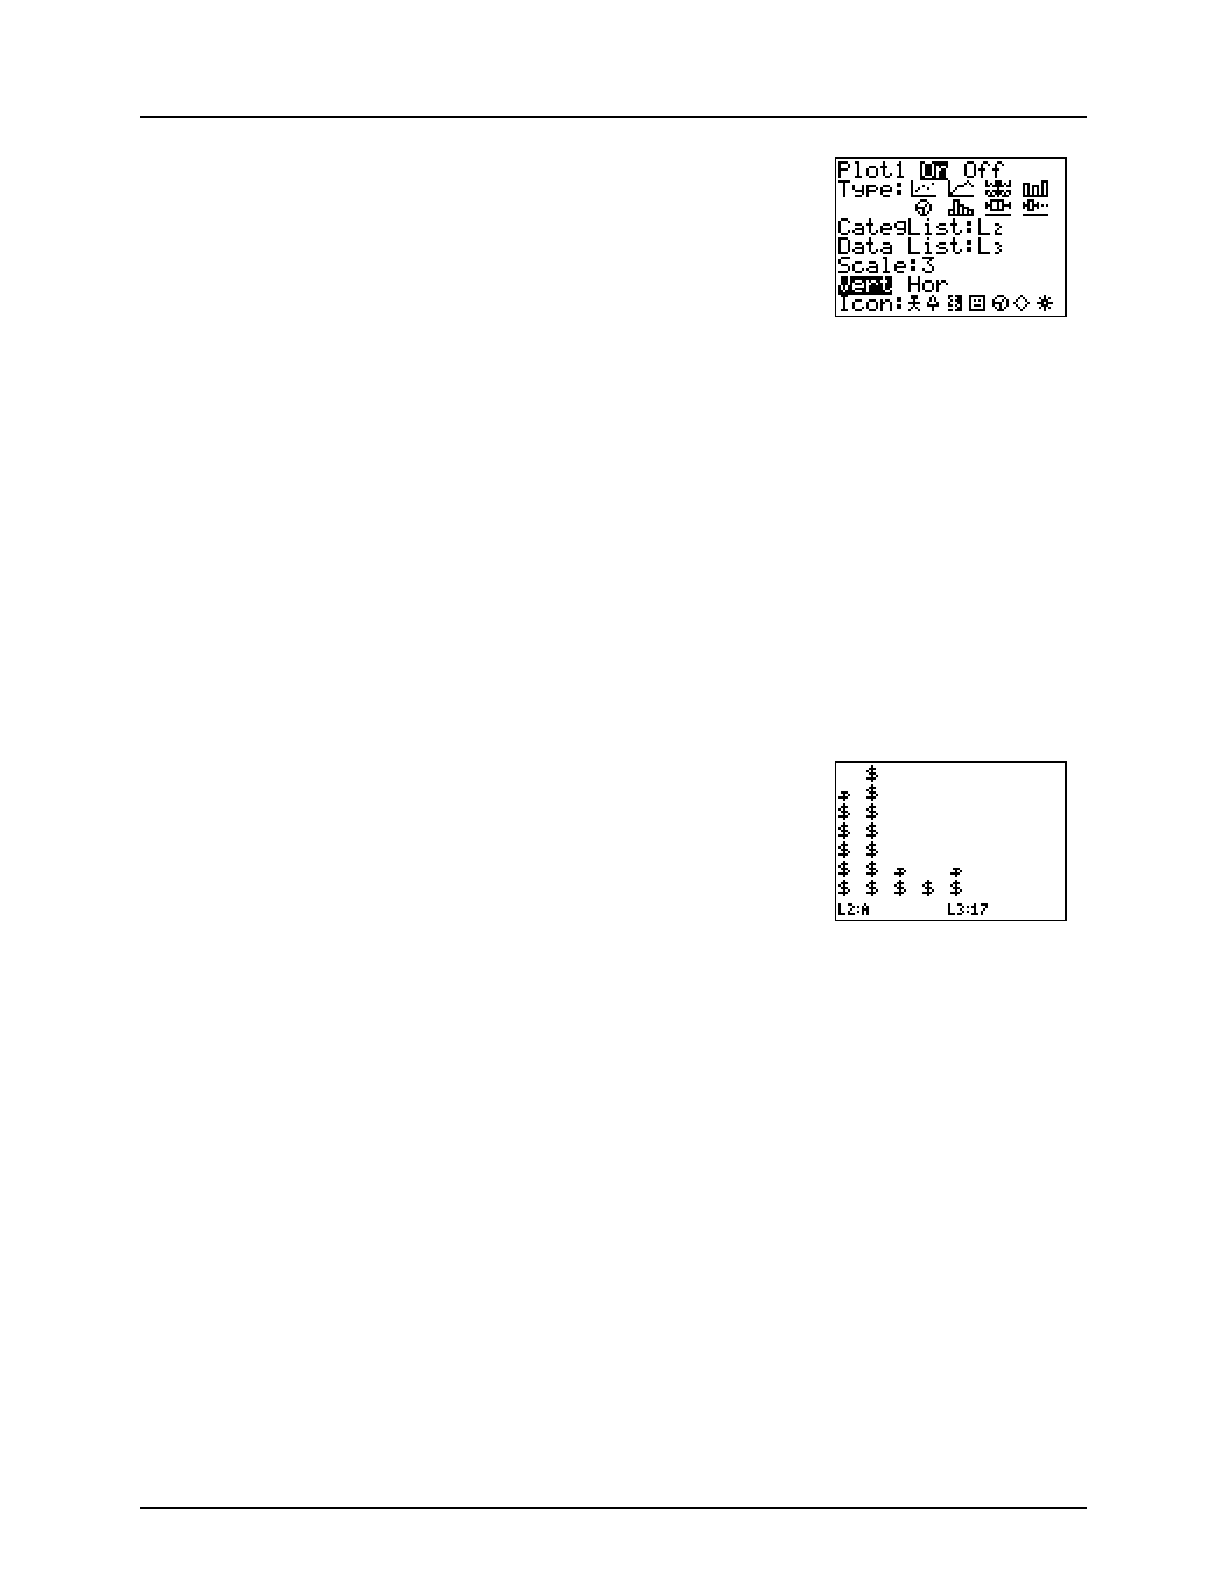
g. Move to
Data List
. If
L
3
is not already set, set it to
L
3
.
# - v [ b
h. Continue setting up the plot. Your screen should
look like the screen at the right. Press b at
Vert
and at the
$
icon.
➪
Scale
tells the TI-73 the
value or quantity each icon
represents. The display
shows a maximum of 7
icons. Choose your scale
based on the largest
number in your data list, or
you can select (
7:ZoomStat
and the TI-73
will select a scale for you.
The largest data number
divided by the scale must
be less than or equal to 7.
For example, if the largest
data number is 21 then
chose a scale of 3 because
21/3
7.
11. View the pictogram.
*
12. Now move around the graph and see the data.
)
! and " to view data
13. Have students sketch their graphs on paper for their
report. (If you have TI-73
TI-GRAPH LINKé, students
may print their graphs to color and label.)
14. Make a bar graph on the TI-73 showing the frequency
results of the polls.
a. Access the
STAT PLOTS
menu.
- e (above the & key)
b. Make sure the other plots are off.
Q b
c. Select
Plot 2
.
- e Z b


