


44
Using the TI-73: A Guide for Teachers
Measurement and Geometry
© 1998 T
EXAS
I
NSTRUMENTS
I
NCORPORATED
Activity
—
Part B
Have students perform the steps unless otherwise
indicated.
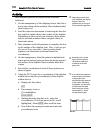
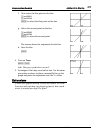
1. Ask students: If the faucet were dripping twice as
fast, what would be the volume after 1 hour? After 2
hours?
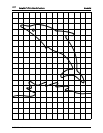
2. Tell students to predict what the graph of this equation
would look like compared to the graph in Part A, step
11.
3. Use the
Manual-Fit
function to plot these data points
for 1 hour and 2 hours.
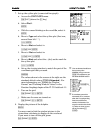
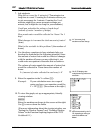
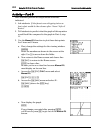
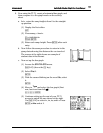
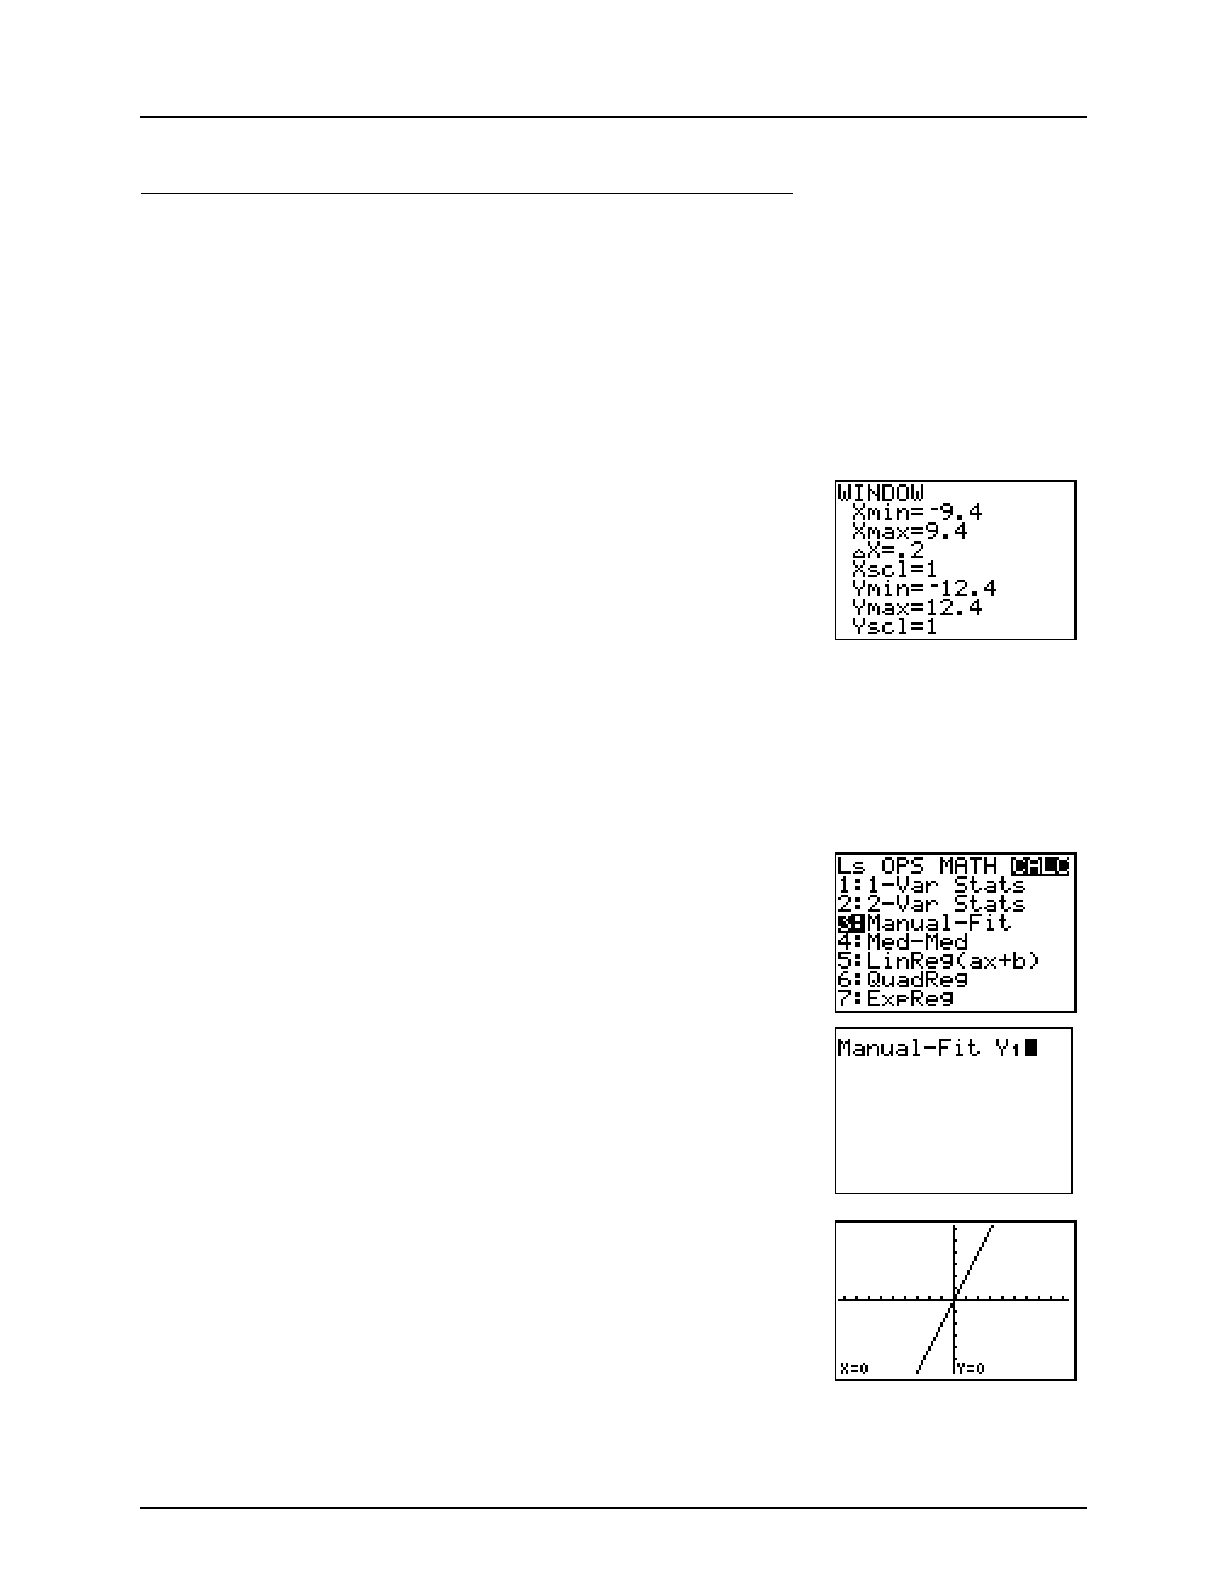
a. First, change the settings for the viewing window.
'
Enter the numbers as shown in the screen at the
right. Use # to move down the fields.
b. Now return to the Home screen and clear a line.
- l to return to the Home screen
: to clear a line
Be sure you’re on a clear line because
Manual-Fit
must display on its own line.
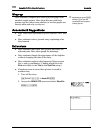
c. Access the - v
CALC
menu and select
Manual-Fit
.
- v " " " [
d. Access the - } menu and select
Y
1
.
- } (above the 9 key)
Z b
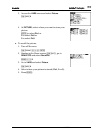
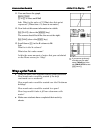
e. Now display the graph.
b
If you change your mind after pressing b,
you’ll have to press ^ to get out of the
Manual-Fit
screen.