


Geometry
Activity 7: The Dolphin
37
© 1998 T
EXAS
I
NSTRUMENTS
I
NCORPORATED
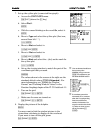
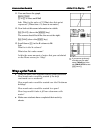
7. Set up the xyLine plot (connected line graph).
a. Access the
STAT PLOTS
menu.
- e (above the & key)
b. Select
Plot 1
.
b
c. With the cursor blinking on the word
On
, select it.
b
d. Move to
Type
and select the xyLine plot (first row,
second from left Ó).
# " b
e. Move to
Xlist
and select
L
1
.
# - v b
f. Move to
Ylist
and select
L
2
.
# - v # b
g. Move to
Mark
and select the
.
(dot) as the mark for
the xyLine plot.
# " " b
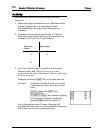
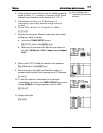
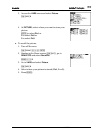
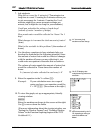
h. Set up the viewing window to match the part of the
coordinate grid that you used.
'
The values shown in the screen at the right are the
standard default values ((
6:Zstandard
). For
more information, see “Setting the Window
Format” and “Defining Window Values” in the
Function Graphing chapter of the TI-73 Guidebook .
i. Turn on the grid.
- g # " b
j. Make sure the axes are turned on.
- g # # b
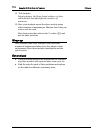
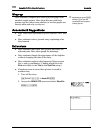
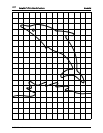
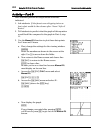
8. Display the picture of the dolphin.
*
You may want to link the student picture to the
viewscreen calculator to display on the overhead.
If you want to turn off the grid, press
- g # b.
➪
Your students should learn
how to set up the
WINDOW, but you can use
(
7:ZoomStat to get
the ideal WINDOW values.
➪
If a student gets a dim
mismatch error, it means
that the 2 corresponding
lists have a different
number of elements. You
may also need to check the
Y= editor to clear or turn
off any functions (
&
:
).