


72
Using the TI-73: A Guide for Teachers
Pr
obability and Statistics
© 1998 T
EXAS
I
NSTRUMENTS
I
NCORPORATED
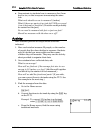
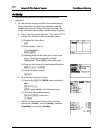
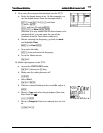
5. Move around the graph and see the data.
)
! and " to view data
➪
A nice connection is to
compare the trace values
for
Xmin
,
median
, and
Xmax
with their calculated
values.
6. Have students sketch and label their plot on paper for
their report. (If you have
TI-73 TI-GRAPH LINKé,
students may print their graphs to color and label.)
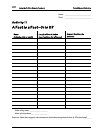
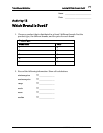
7. Have students poll 50 people (students, teachers, and
other adults) to find out which of the brands they
would actually buy. Have them record the responses in
the table provided on the activity sheet.
Students should try to poll those who would actually
want to buy the product. They should ask the person
why they chose that brand and include their responses
with their student analyses.
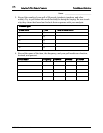
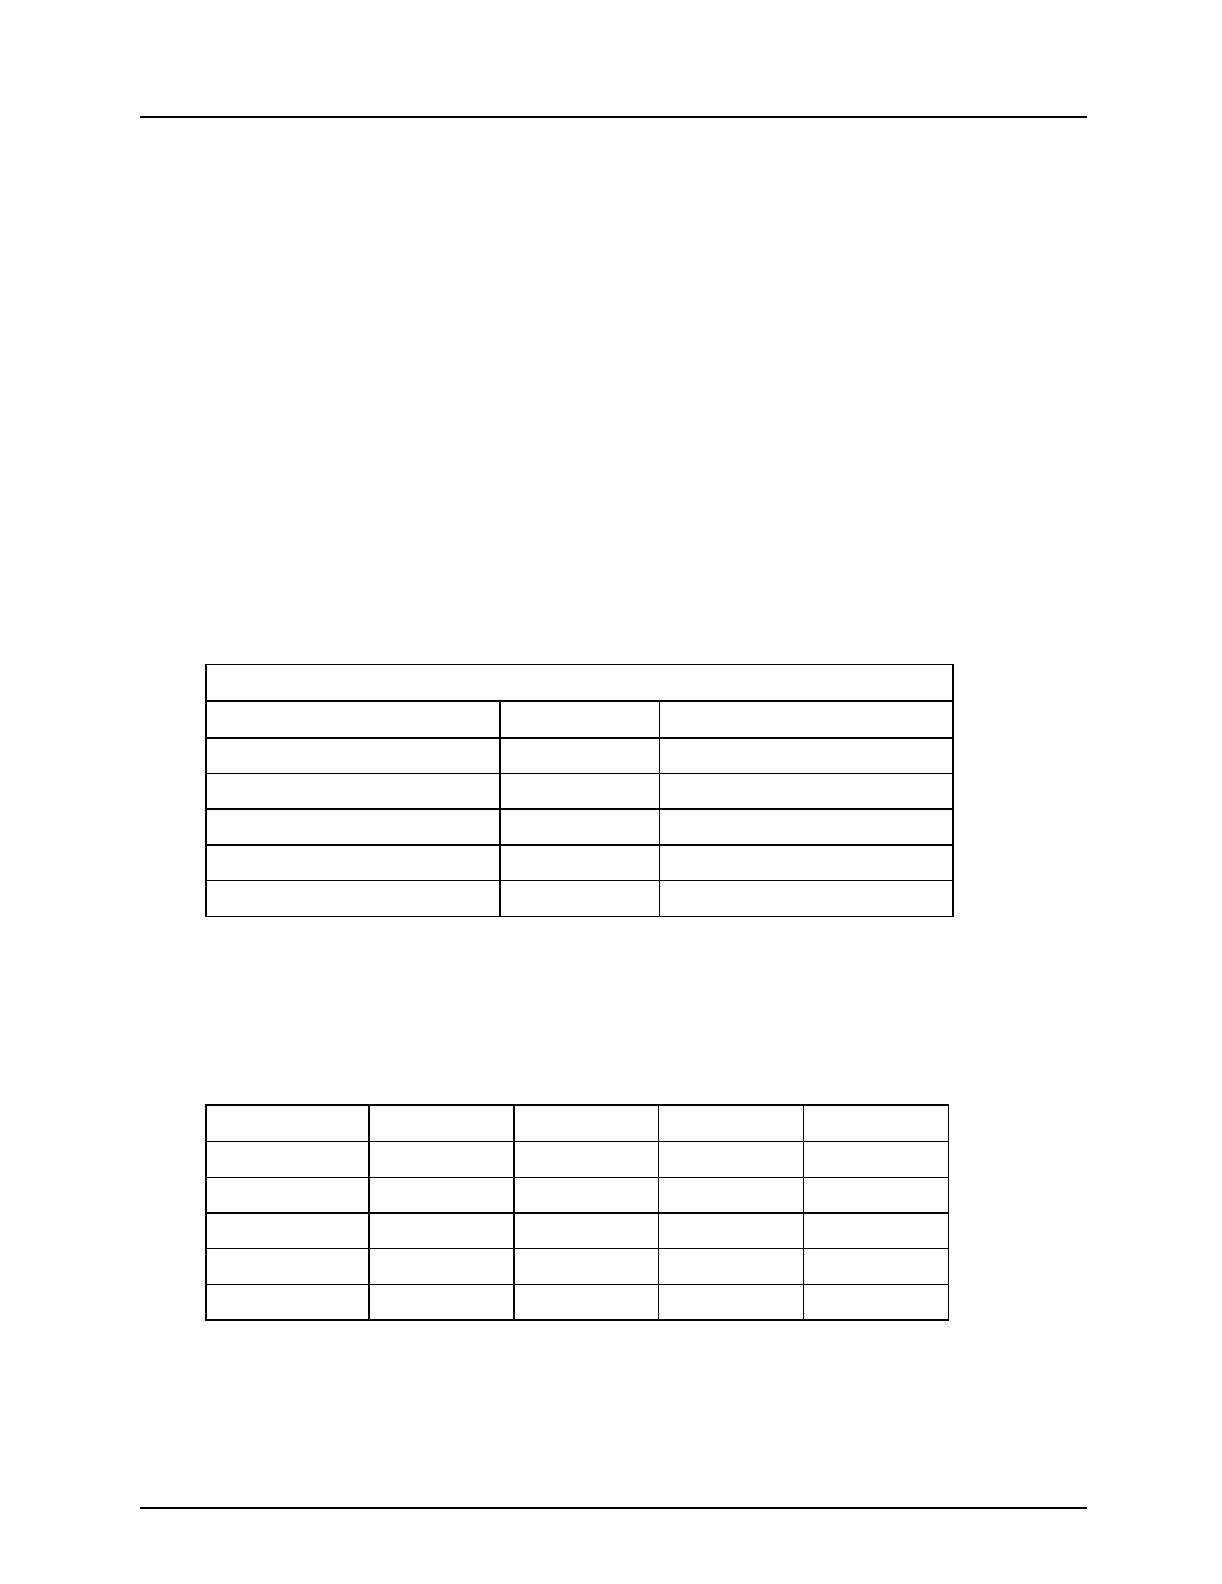
Example poll
Product Type:
Brand Name
Price
Tally for each choice
1. Brand A
$1.89
lllll lllll lllll ll
2. Brand B
$2.25
lllll lllll lllll lllll
3. Brand C
$1.89
lllll
4. Brand D
$1.86
lll
5. Brand E
$1.98
llll
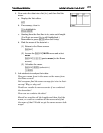
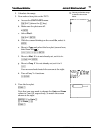
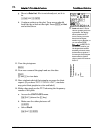
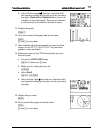
8. In the table on the activity sheet, have students record
the name of their product, the frequency, and their poll
results as a fraction, decimal, and percent.
➪
You can use =
to enter
fractions (numerator =
denominator "
) and >
to convert them to
decimals.
Example table
Brand Name
Frequency
Fraction
Decimal
Percent
Brand A
17
17/50
0.34
34%
Brand B
21
21/50
0.42
42%
Brand C
5
5/50
0.10
10%
Brand D
3
3/50
0.06
6%
Brand E
4
4/50
0.08
8%