


Probability
Activity 10: Give Me Five
59
© 1998 T
EXAS
I
NSTRUMENTS
I
NCORPORATED
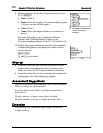
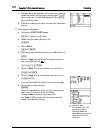
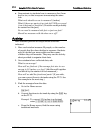
18. Turn on trace.
)
! and " to move along the histogram
Discuss the following questions.
In our class data, which outcomes are least likely?
Which outcomes are most likely?
Compare this to your small group data. Is it the
same? If not, what makes the difference? (sample size)
Wrap-up for Part A
♦ Ask students: Which scores on a single toss are
equally likely (have the same probability)?
♦ Have students list the ways to get a sum of 1.
(H T T T T T H T T T T T H T T T T T H T
T T T T H)
♦ Now have students list the ways to get a sum of 4 to
verify that the sums of 1 and 4 are equally likely.
(H H H H T H H H T H H H T H H H T H H H
T H H H H)
Assessment Suggestion for Part A
Have students record in their journals how they
determined which outcomes were most or least likely to
occur.
Activity
—
Part B (for Advanced Classes)
Have students perform the steps unless otherwise
indicated.
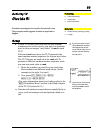
1. Discuss the difference between the probabilities that
were gathered (experimental probabilities) and the
probabilities that should have happened (theoretical
probabilities).
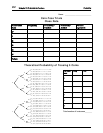
2. Use the tree diagram on the activity sheet to find the
expected (theoretical) probabilities and record them
on the activity sheet.