


58
Using the TI-73: A Guide for Teachers
Probability
© 1998 T
EXAS
I
NSTRUMENTS
I
NCORPORATED
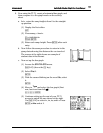
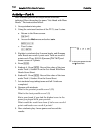
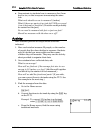
c. Starting from the first line in
L
1
, enter the possible
points as shown in the screen at the right. (You’ll
get an error if
L
1
is still highlighted.) Press b
after each list item.
d. Follow the same procedure to enter the class data
into
L
2
.
17. Now graph a histogram.
a. Access the
STAT PLOTS
menu.
- e (above the & key)
b. Make sure the other plots are off.
Q b
c. Select
Plot 1
.
- e b
d. With the cursor blinking on the word
On
, select it.
b
e. Move to
Type
and select the histogram (second
row, second from left Ò).
# " " " " " b
f. Move to
Xlist
. If
L
1
is not already set, set it to
L
1
.
# - v b
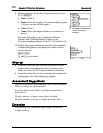
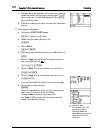
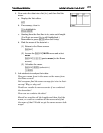
g. Move to
Freq
. If
L
2
is not already set, set it to
L
2
.
# - v Z
Your screen should look like the one at the right.
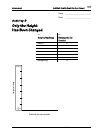
h. Set up the viewing window.
'
Enter the numbers as shown in the screen at the
right. Use # to move down the fields.
Change
Ymax
to match your class data.
Set
Ymin
to
-50
so that both the values and the
graph show during tracing.
➪
Note that
@
X
is
determined by the TI-73,
depending on what is
entered for
Xmin
and
Xmax
.
Xscl
represents the
width of the bar on the
histogram.