Probability
Activity 10: Give Me Five
57
© 1998 T
EXAS
I
NSTRUMENTS
I
NCORPORATED
10. Discuss with students:
How many total trials did you and your partner
have?
Raise your hand if you had a 5-point toss. Raise
your hand if you had a 0-point toss.
Which score on a single trial would you predict is
more likely to occur, 0 or 5?
Out of the 50 trials, how many trials would you
predict to be worth 5 points?
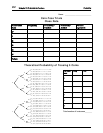
11. Record group data in the Coin-Toss Trials Small Group
Data table provided.
To calculate the probability, use:
# of times event occurred / total # of trials
12. Add the probability column, and then discuss why the
sum is 1.
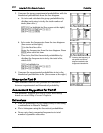
13. Convert the probability fraction to decimal form using
the > key. Record this in the decimal column of the
Small Group Data table.
➪
Students should record
probabilities as
unsimplified fractions and
also in simplest fractional
form. Verify the total
number of trials as 50 by
adding the frequency
column.
14. Ask students:
How do the probabilities between your group and
other groups compare?
Does one outcome seem to be more probable than
others?
Is one less probable?
15. Collect the class data and have students record it in
the Class Data table.
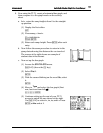
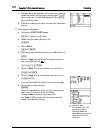
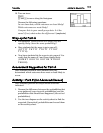
16. Enter the class data into the TI-73 using lists. Use
L
1
for the points and
L
2
for the frequencies.
a. Display the List editor.
3
b. If necessary, clear
L
1
.
$ to highlight
L
1
: b
➪
In the student pairs, have
Student A call out
frequencies for points on
each roll while Student B
keeps a running total of the
frequencies either mentally
or with the
TI-73.


