


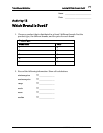
Probability and Statistics
Activity 12: Which Brand is Best?
75
© 1998 T
EXAS
I
NSTRUMENTS
I
NCORPORATED
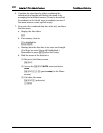
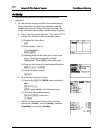
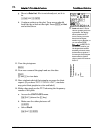
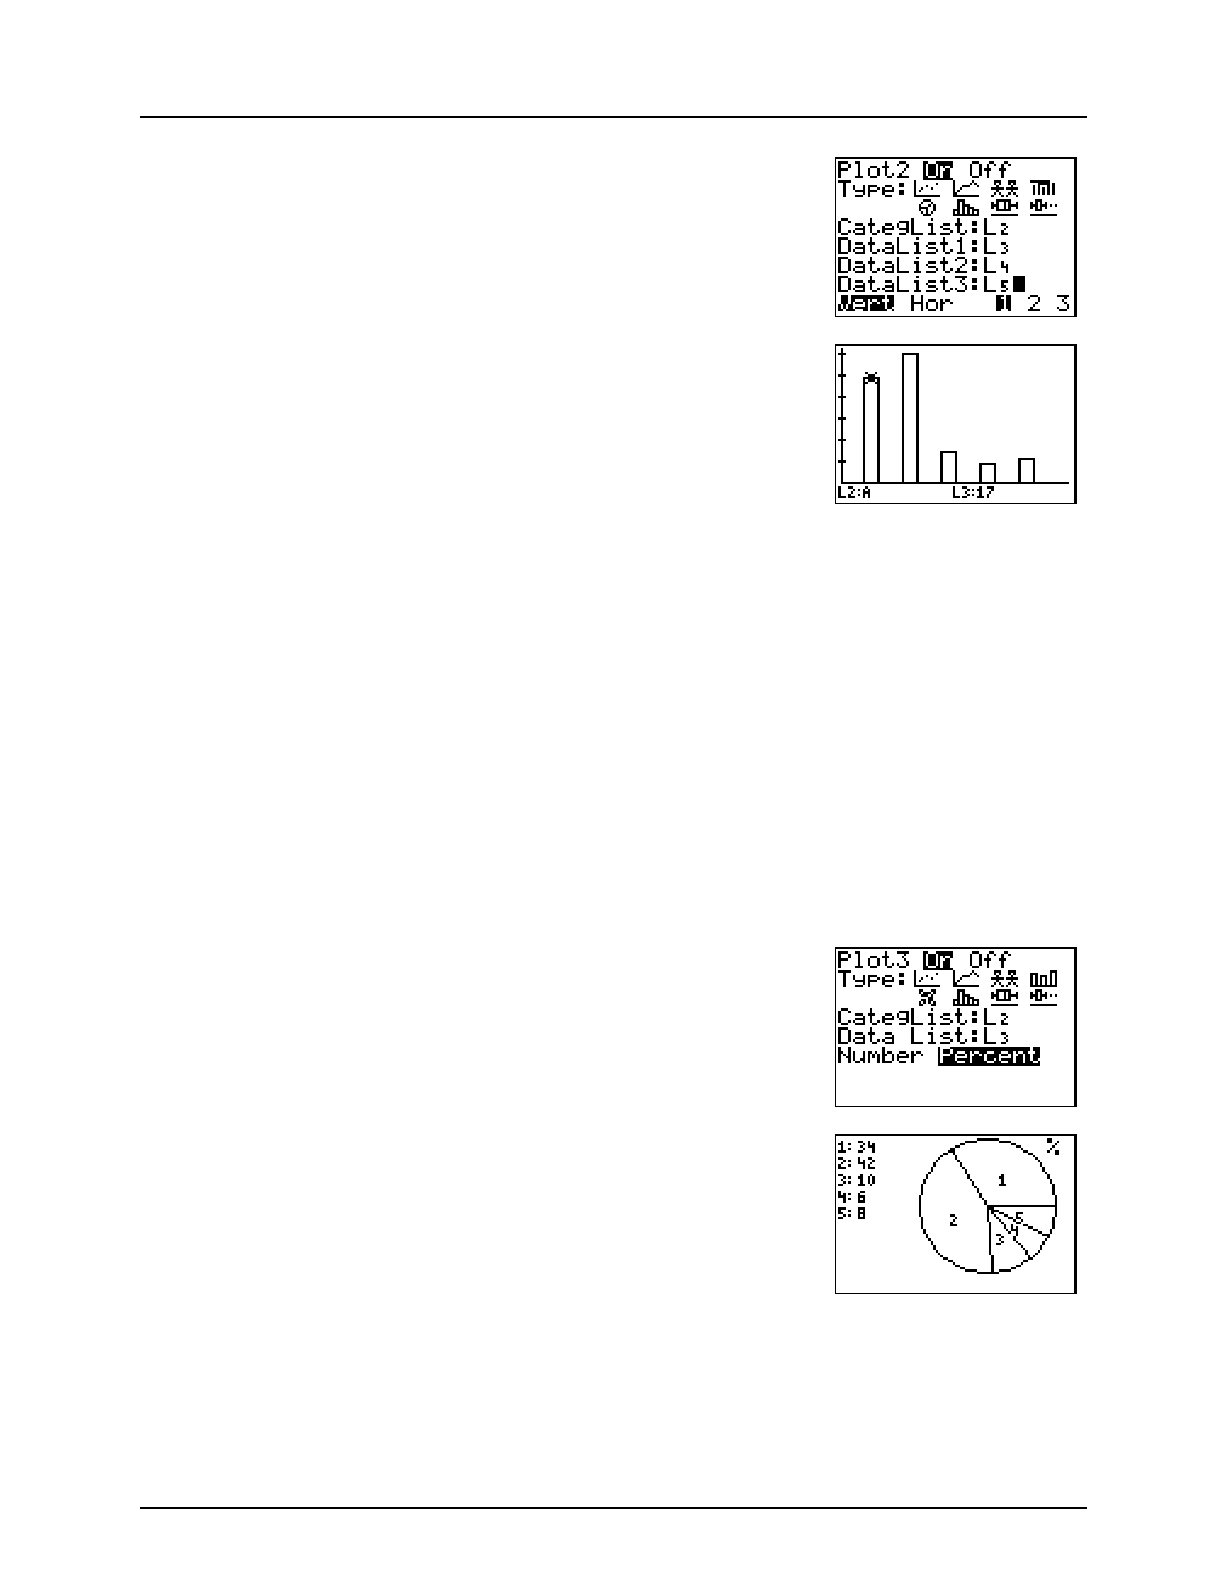
d. Select the bar graph Ð (first row, last from left)
and continue setting up the plot as in the picture at
the right. (
DataList2
and
DataList3
allow you to do
a double or triple bar graph. They are not relevant
to this activity, and whatever is listed is okay.)
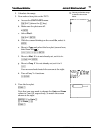
15. Display the graph.
( J
16. Now move around the graph and see the data.
)
! and " to view data
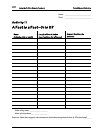
17. Have students sketch their graphs on paper for their
report (or use TI-73
TI-GRAPH LINKé to print their
graphs to color and label).
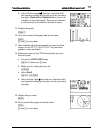
18. Make a pie chart on the TI-73 showing the percents
from the polls.
a. Access the
STAT PLOTS
menu.
- e (above the & key)
b. Make sure the other plots are off.
Q b
c. Select
Plot 3
.
- e [ b
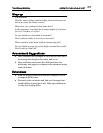
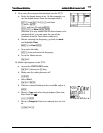
d. Select the pie chart Ï (second row, first from left)
and continue setting up the plot as in the picture at
the right.
19. Display the pie chart.
*
20. Move around the graph and see the data.
)
! and " to view data