


52
Using the TI-73: A Guide for Teachers
Measurement
© 1998 T
EXAS
I
NSTRUMENTS
I
NCORPORATED
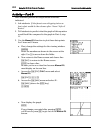
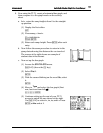
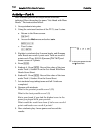
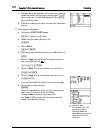
9. Before graphing, set up the viewing window for each
TI-73 (').
•
Xmin
will be 0.
•
Xmax
will be the height of the ramp straight up plus
5 (so you can see the full graph).
•
Ymin
will be 0.
•
Ymax
will be the longest distance a car traveled
plus 5.
For more information, see “Setting the Window
Format” and “Defining Window Values” in the
Function Graphing chapter of the TI-73 Guidebook .
➪
The
Xmax
and
Ymax
values
shown here are
just
examples.
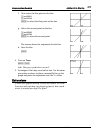
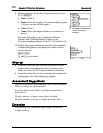
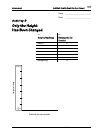
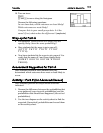
10. Display the graph and discuss the data. Have students
compare this graph to the graph they made on their
activity sheets.
* )
$ and # to view data
Wrap-up
♦ Combine class data and calculate the mean for each
height using an overhead calculator. Do this on the
Home screen of the TI-73 using traditional methods.
♦ Graph the class data on the overhead and compare the
class graph to the individual group graphs.
Assessment Suggestions
Discuss as a class or have students write in their journals:
What is similar in all the graphs?
Are there differences? What could have caused these
differences?
Would a shorter or longer ramp affect the data?
Would a smaller or larger car affect the data? How?
Extension
Test the affect of varying the ramp length, car size or
weight, or floor.