


69
© 1998 T
EXAS
I
NSTRUMENTS
I
NCORPORATED
Activity 12
Which Brand Is Best?
In this real-world activity, students comparison shop in
their community. Then they produce consumer reports
to share their findings with their class.
Probability and Statistics
♦
measures of central tendency (mean,
median, mode, range, quartiles)
♦
graphs (box plot, pictograph, bar
graph, pie chart)
♦
tables
Materials
♦
student activity sheets (provided)
♦
TI-73
³
Setup
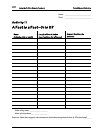
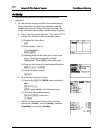
♦ Explain to students that they need to find 5 or more
different brand names of the same product. Then they
need to record the brands and prices for the product
chosen (no purchase necessary).
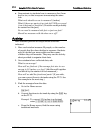
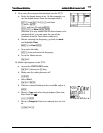
Example
Brand Names
Prices
Brand A
$1.89
Brand B
$2.25
Brand C
$1.89
Brand D
$1.86
Brand E
$1.97
➪
Make sure that the 5
prices the students list
are not all the same.
♦ Allow 2 to 3 days for each student to “shop” and select
a product to research.