DUA1640-5AAA02
Load Balancing B-21
Viewing Utilization
History
If you click the
History
tab to the top of the panel, the Utilization
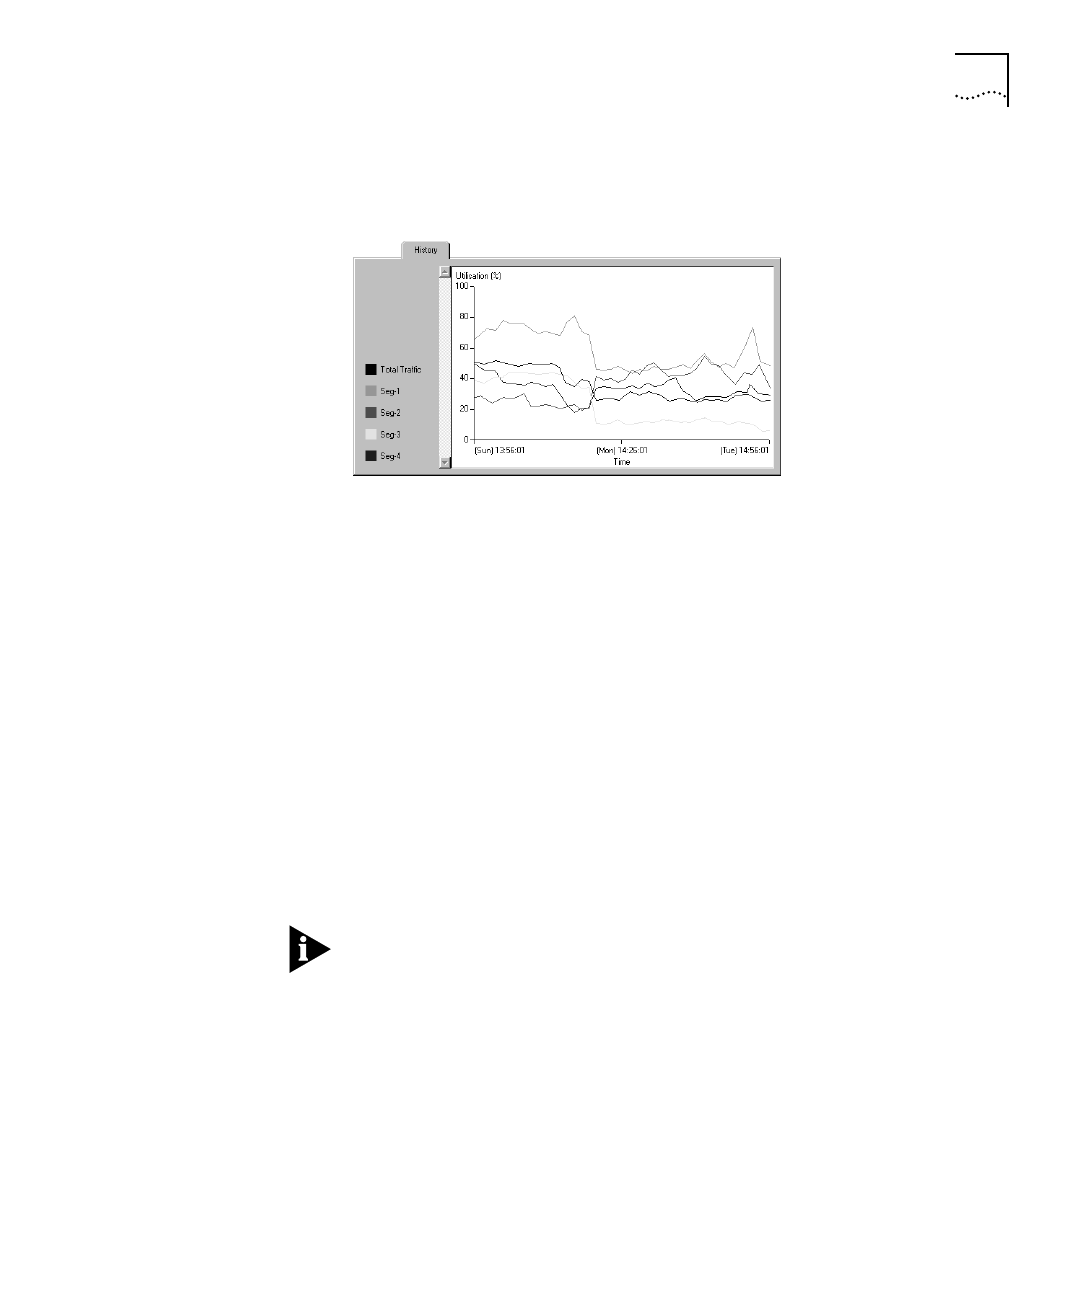
History page is displayed, as shown in Figure B-11.
Figure B-11
Utilization History Page
This page shows a graph of the utilization history for:
■
The total traffic that is being produced across all the segments in
the stack — The utilization is the percentage of the total available
bandwidth used to transmit valid and errored packets. It does not
include bandwidth wasted due to collisions.
■
All the cascaded and isolated segments.
The graph displays the values as percentages.
When the PS Hub is powered on, it starts recording the values for each
segment. When you view the Utilization History page, information that
has already been recorded is displayed. If the PS Hub has only just been
powered on, the graph will not display much information. The graph is
updated on each poll, if new information is available.
The PS Hub uses default RMON sessions to record the utilization history
of the segments. If you delete any of these sessions using an SNMP
Network Management Application, the PS Hub will be unable to record
information for those segments and it will not be displayed by the Load
Balancing Tool’s Utilization History page.


