


Using the Explore Window 411
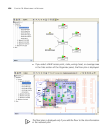
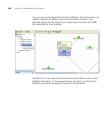
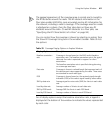
The jagged appearance of the coverage area is normal and is caused by
the RF obstacles around the radio. The RF obstacle information in the
floor plan enables 3WXM to more accurately portray RF information for
the network, including a radio’s coverage. If the coverage area for a radio
is displayed as a sphere, then the floor plan does not have any RF
obstacles around the radio. (To add RF obstacles to a floor plan, see
“Specifying the RF Characteristics of a Floor” on page 94.)
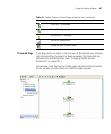
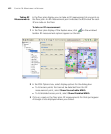
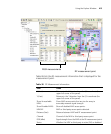
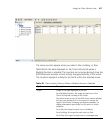
You can control how the coverage is shown by selecting an option from
the Show RF Coverage Using box in the window’s toolbar. Table 35 lists
the options.
For all display options except the baseline association rate, a legend is
displayed at the bottom of the window to indicate the values represented
by each color.
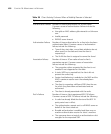
Table 35 Coverage Display Options in Explore Window
Display Option Description
Baseline association
rate
Coverage is shown based on the MAP radio’s baseline
association rate. The baseline association rate is the typical
data rate the radio is expected to support for client
associations.
The baseline association rate is specified during planning,
on a coverage area basis.
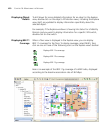
Data rate Coverage is shown in colored bands that represent each of
the data transmit rates supported by the radio. These rates
are standard for each radio type.
RSSI Coverage is shown based on the received signal strength
indication (RSSI) of the radio’s signal heard by other radios.
SNR by data rate Average signal-to-noise ratio (SNR) for clients in each data
rate.
Load by data rate Average number of clients at each data rate.
SNR by RSSI bands Average SNR for clients in each RSSI band.
Load by RSSI bands Average number of clients in each RSSI band.