


20050401
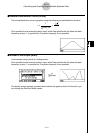
• Mark Type
This setting lets you specify the shape of the plot points on the graph.
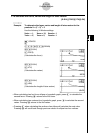
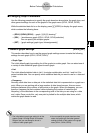
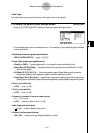
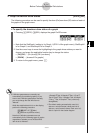
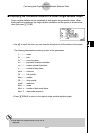
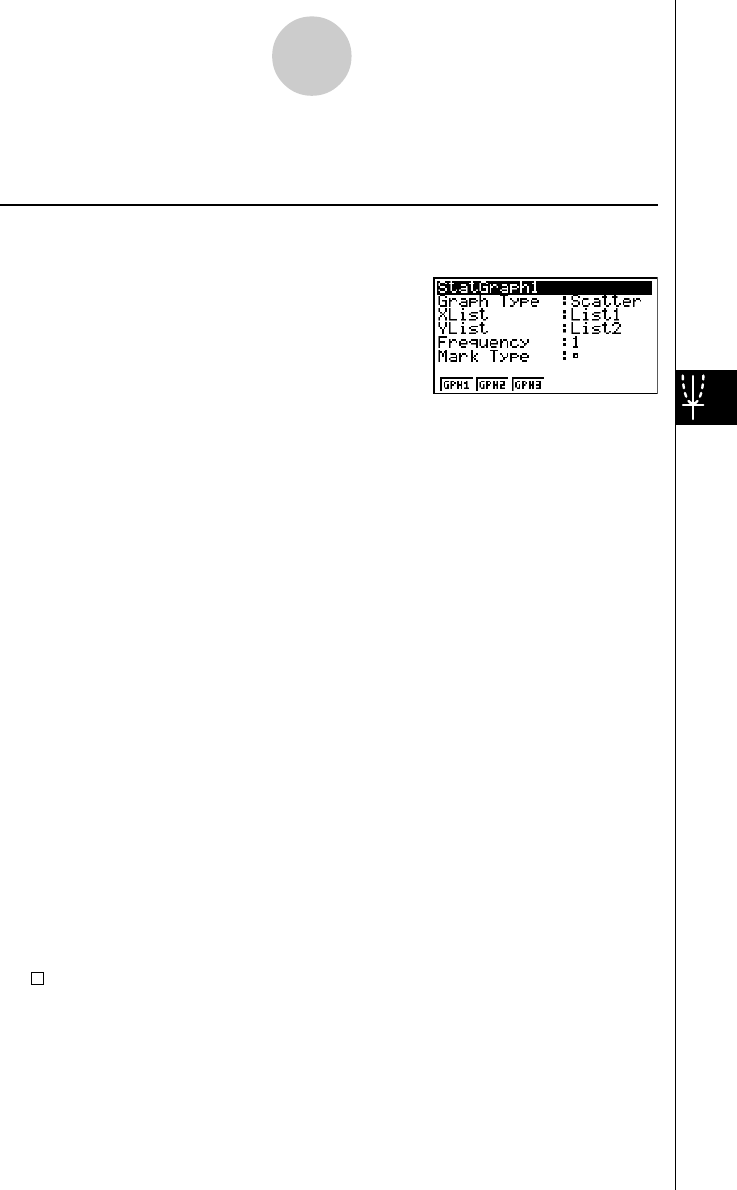
u To display the general graph settings screen [GRPH]-[SET]
Pressing 1(GRPH)6(SET) displays the general graph settings screen.
• The settings shown here are examples only. The settings on your general graph settings
screen may differ.
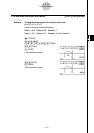
• StatGraph (statistical graph specification)
•{GPH1}/{GPH2}/{GPH3} ... graph {1}/{2}/{3}
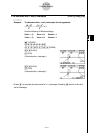
• Graph Type (graph type specification)
•{Scat}/{xy}/{NPP} ... {scatter diagram}/{xy line graph}/{normal probability plot}
•{Hist}/{Box}/{N·Dis}/{Brkn} ... {histogram}/{med-box graph}/{normal distribution curve}/
{broken line graph}
•{X}/{Med}/{X^2}/{X^3}/{X^4} ... {linear regression graph}/{Med-Med graph}/{quadratic
regression graph}/{cubic regression graph}/{quartic regression graph}
•{Log}/{Exp}/{Pwr}/{Sin}/{Lgst} ... {logarithmic regression graph}/{exponential regression
graph}/{power regression graph}/{sinusoidal regression graph}/{logistic regression graph}
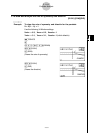
• XList (x-axis data list)
•{LIST} ... {List 1 to 26}
• YList (y-axis data list)
•{LIST} ... {List 1 to 26}
• Frequency (number of times a value occurs)
•{1} ... {1-to-1 plot}
•{LIST} ... frequency data in {List 1 to 26}
• Mark Type (plot mark type)
•{ }/{×}/{•} ... scatter diagram plot points
• Outliers (outliers specification)
•{On}/{Off} ... {display}/{do not display} Med-Box outliers
6-1-3
Before Performing Statistical Calculations