


20050401
kk
kk
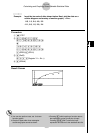
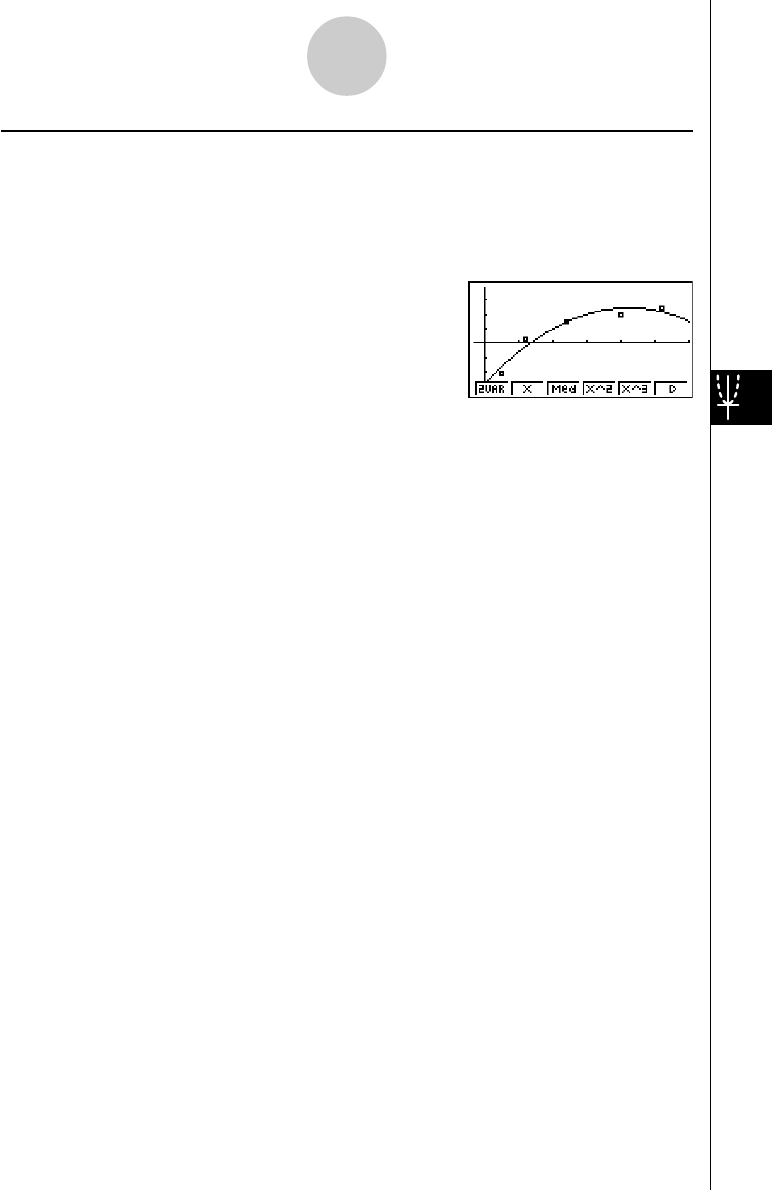
k Quadratic/Cubic/Quartic Regression Graph
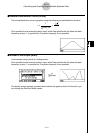
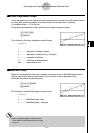
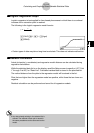
A quadratic/cubic/quartic regression graph represents connection of the data points of a
scatter diagram. It uses the method of least squares to draw a curve that passes close to as
many data points as possible. The formula that represents this is quadratic/cubic/quartic
regression.
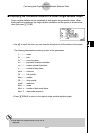
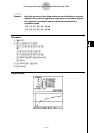
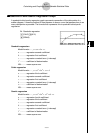
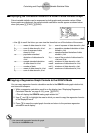
Ex. Quadratic regression
1(CALC)4(X^2)
6(DRAW)
Quadratic regression
Model formula ..... y = ax
2
+ bx + c
a .............
regression second coefficient
b ............. regression first coefficient
c ............. regression constant term (y-intercept)
r
2
............ coefficient of determination
MSe ........ mean square error
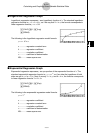
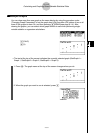
Cubic regression
Model formula ..... y = ax
3
+ bx
2
+ cx + d
a .............
regression third coefficient
b ............. regression second coefficient
c ............. regression first coefficient
d ............. regression constant term (y-intercept)
r
2
............ coefficient of determination
MSe ........ mean square error
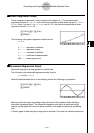
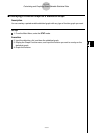
Quartic regression
Model formula ..... y = ax
4
+ bx
3
+ cx
2
+ dx + e
a .............
regression fourth coefficient
b ............. regression third coefficient
c ............. regression second coefficient
d ............. regression first coefficient
e ............. regression constant term (y-intercept)
r
2
............ coefficient of determination
MSe ........ mean square error
6-3-7
Calculating and Graphing Paired-Variable Statistical Data