


20050401
kk
kk
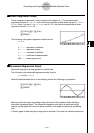
k Power Regression Graph
Power regression expresses y as a proportion of the power of x. The standard power
regression formula is
y = a × x
b
, so if we take the logarithm of both sides we get In y = In a +
b × In x. Next, if we say X = In x, Y = In y, and A = In a, the formula corresponds to linear
regression formula Y = A +
bX.
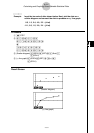
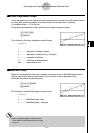
1(CALC)6(g)4(Pwr)
6(DRAW)
The following is the power regression model formula.
y = a
•
x
b
a ............. regression coefficient
b ............. regression power
r.............. correlation coefficient
r
2
............. coefficient of determination
MSe ........ mean square error
kk
kk
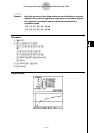
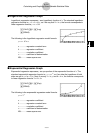
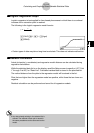
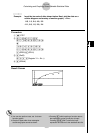
k Sinusoidal Regression Graph
Sinusoidal regression is best applied for cyclical data.
The following is the sinusoidal regression model formula.
y = a·sin(bx + c) + d
While the statistical data list is on the display, perform the following key operation.
1(CALC)6(g)5(Sin)
6(DRAW)
Make sure that the angle unit setting of the calculator is Rad (radians) when drawing a
sinusoidal regression graph. The sinusoidal regression calculation is performed using
radians, so the graph will cannot be drawn correctly if the angle unit setting is something
else.
• Certain types of data may take a long time to calculate. This does not indicate malfunction.
6-3-9
Calculating and Graphing Paired-Variable Statistical Data
20060601