


20050401
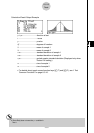
# Graphing is available with Two-Way ANOVA
only. V-Window settings are performed
automatically, regardless of Setup screen
settings.
# Using the Trace function automatically stores
the number of conditions to alpha variable A
and the mean value to variable M,
respectively.
6-5-23
Tests
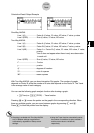
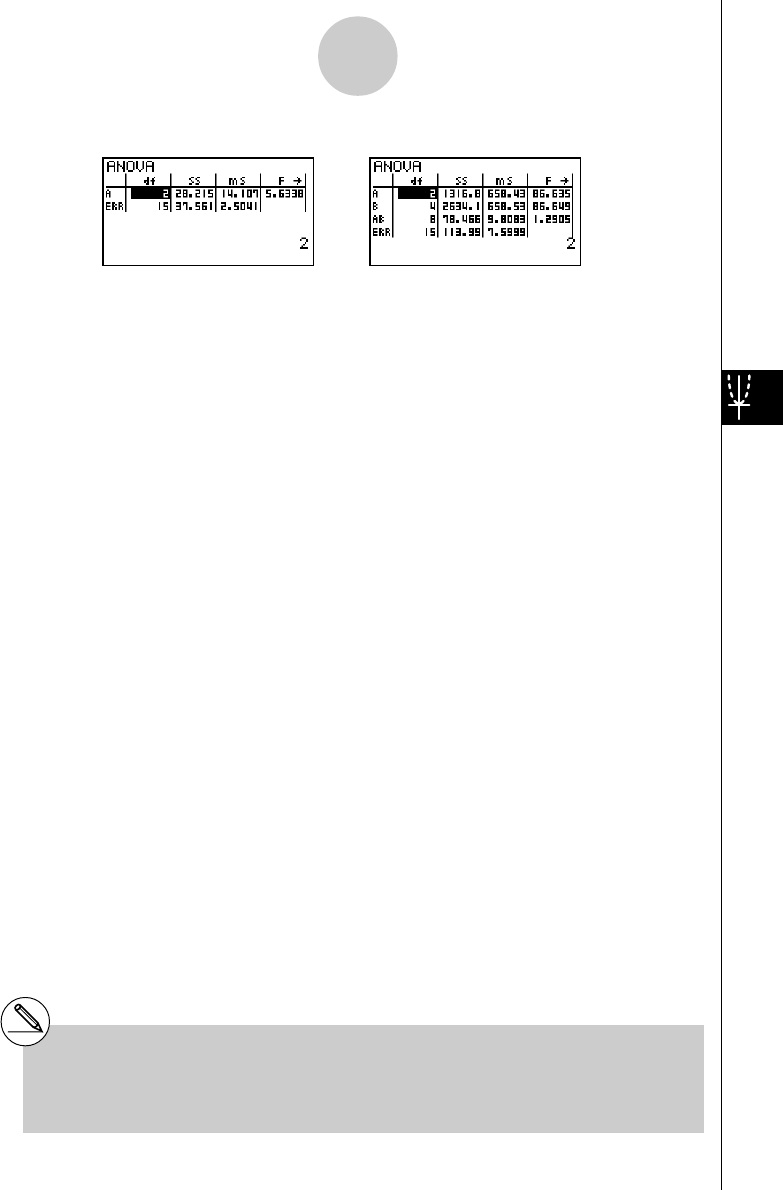
Calculation Result Output Example
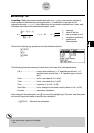
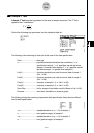
One-Way ANOVA
Line 1 (A) .................... Factor A df value, SS value, MS value, F value, p-value
Line 2 (ERR) ............... Error df value, SS value, MS value
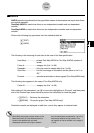
Two-Way ANOVA
Line 1 (A) .................... Factor A df value, SS value, MS value, F value, p-value
Line 2 (B) .................... Factor B df value, SS value, MS value, F value, p-value
Line 3 (AB) .................. Factor A × Factor B df value, SS value, MS value, F value,
p-value
*Line 3 does not appear when there is only one observation
in each cell.
Line 4 (ERR) ............... Error df value, SS value, MS value
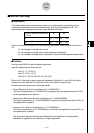
F.................................. F value
p .................................. p-value
df ................................. degrees of freedom
SS ................................ sum of squares
MS............................... mean squares
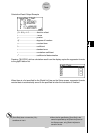
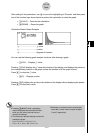
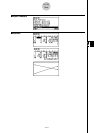
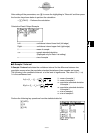
With Two-Way ANOVA, you can draw Interaction Plot graphs. The number of graphs
depends on Factor B, while the number of X-axis data depends on the Factor A. The Y-axis
is the average value of each category.
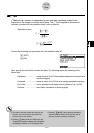
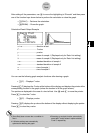
You can use the following graph analysis function after drawing a graph.
• 1(Trace) or !1(TRCE) ... Trace function
Pressing d or e moves the pointer on the graph in the corresponding direction. When
there are multiple graphs, you can move between graphs by pressing f and c.
Press J to clear the pointer from the display.