20050401
9-6-2
Statistical Graphs
kk
kk
k Configuring Graph Parameter Settings
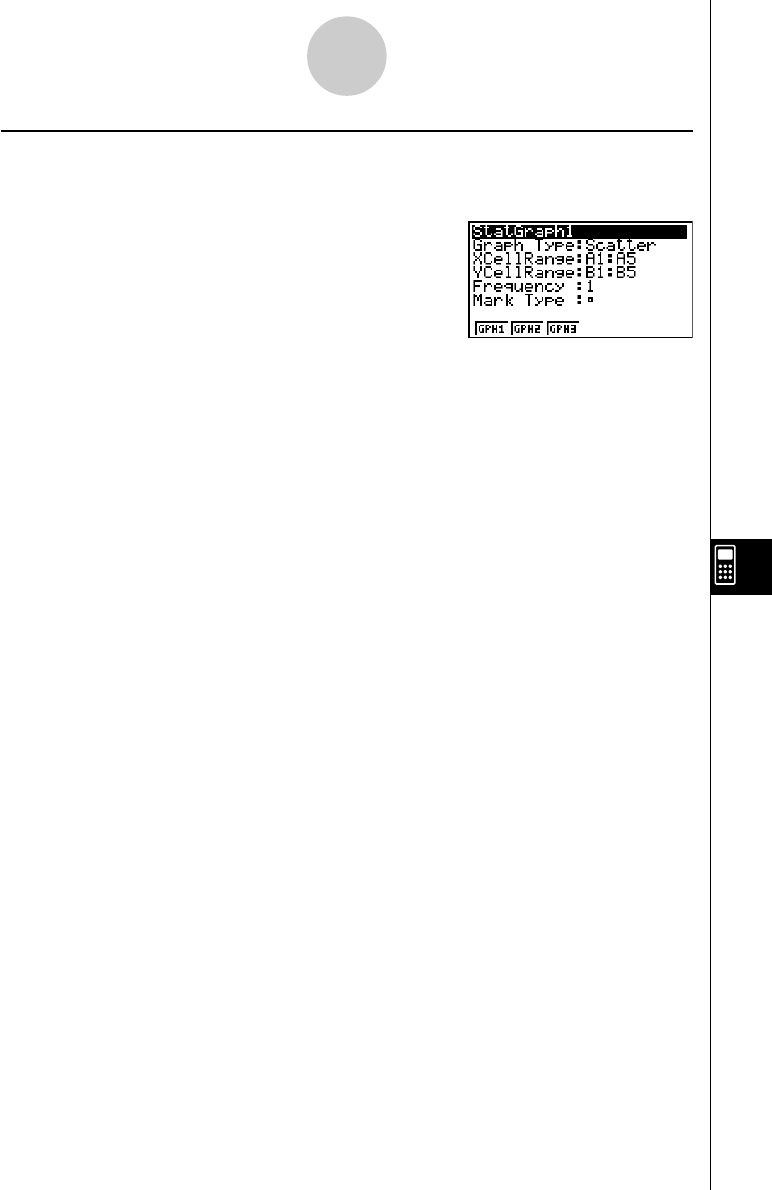
Pressing 6(SET) on the GRPH submenu displays a graph settings screen like the one
shown below.
In the STAT mode, you can graph data input with the List Editor. In the S
•
SHT mode, you
can graph the data input into the spreadsheet cells. Because of this, the purpose of S
•
SHT
mode graph settings is to select the range of cells that contain the data to be graphed. The
purpose of STAT mode settings, on the other hand, is to specify the number of the list (List 1
through List 26) where the data to be graphed is located.
The following describes the Spreadsheet graph settings you can configure on the graph
settings screen.
u XCellRange (range x-axis data cells)
•{Cell} … {the specified cell range data corresponds to x-axis data}
u YCellRange (range y-axis data cells)
•{Cell} … {the specified cell range data corresponds to y-axis data}
u Frequency (number of times a value occurs)
•{1} … {specifies 1 as the frequency of the values in the cell ranges specified by
XCellRange and YCellRange}
•{Cell} … {range of cells that specify the frequency for each cell specified by XCellRange
and YCellRange}
For example, if XCellRange = A3:A5, YCellRange = B3:B5, and Frequency =
C3:C5, the frequency of A3 and B3 will be the value in C3, the frequency of A4
and B4 will be C4, and so on.
For information on other settings, see “1. General graph settings” on page 6-1-2.


