


E-84
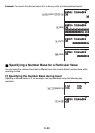
For more information about this type of regression calculation: Go here:
Power Regression <#07>
Inverse Regression <#08>
k
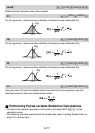
Statistical Calculation Examples
This section provides some actual examples of statistical calculation examples as they are
performed on your calculator.
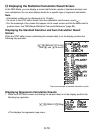
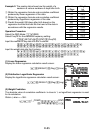
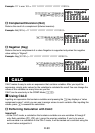
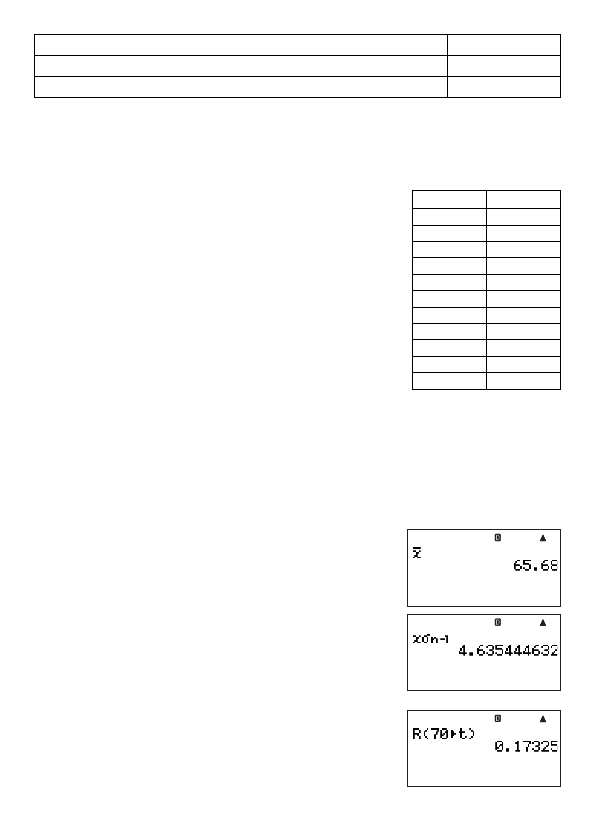
Example 1: The nearby table shows the pulse rates of 50
students who attend a high school for boys that
has a total enrollment of 1,000 students.
1
Determine the mean and standard deviation of the sample
data.
2
Assuming that the population distribution is a normal
distribution, determine the distribution probability of students
with pulse rates of 70 of greater.
Pulse Rate Students
54 – 56 1
56 – 58 2
58 – 60 2
60 – 62 5
62 – 64 8
64 – 66 9
66 – 68 8
68 – 70 6
70 – 72 4
72 – 74 3
74 – 76 2
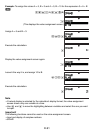
Operation Procedure
Select the SD Mode:
N
3
(SD)
Select FreqOn for the statistical frequency setting:
1N
(SETUP)
c
5
(STAT)
1
(FreqOn)
Input the pulse rate data into the X-column:
55
E
57
E
59
E
61
E
63
E
65
E
67
E
69
E
71
E
73
E
75
E
Input the number of students data into the FREQ-column:
ce
1
E
2
E
2
E
5
E
8
E
9
E
8
E
6
E
4
E
3
E
2
E
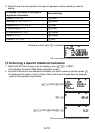
(1) Mean and Standard Deviation
Obtain the mean:
z
1
(
/
COMP)
z
7
(STAT)
2
(VAR)
2
(
o
)
E
Obtain the sample standard deviation:
z
7
(STAT)
2
(VAR)
4
(
x
σ
n
–1
)
E
(2) Distribution Probability
z
7
(STAT)
3
(DISTR)
3
(R()
70
z
7
(STAT)
3
(DISTR)
4
(
'
t
)
)
E