5-1
Chapter 5 Graphing
Select the icon in the Main Menu that suits the type of graph you want to draw or the type of table
you want to generate.
• GRAPH … General function graphing
• RUN•MAT (or RUN) … Manual graphing (pages 5-12 to 5-15)
• TABLE … Number table generation (pages 5-15 to 5-19)
• DYNA* … Dynamic graphing (pages 5-20 to 5-22)
• RECUR* … Recursion graphing or number table generation (pages 5-22 to 5-26)
• CONICS* … Conic section graphing (page 5-27)
* Not included on the fx-7400Gɉ.
1. Sample Graphs
I How to draw a simple graph (1)
To draw a graph, simply input the applicable function.
1. From the Main Menu, enter the GRAPH mode.
2. Input the function you want to graph.
Here you would use the V-Window to specify the range and other parameters of the graph.
See page 5-2.
3. Draw the graph.
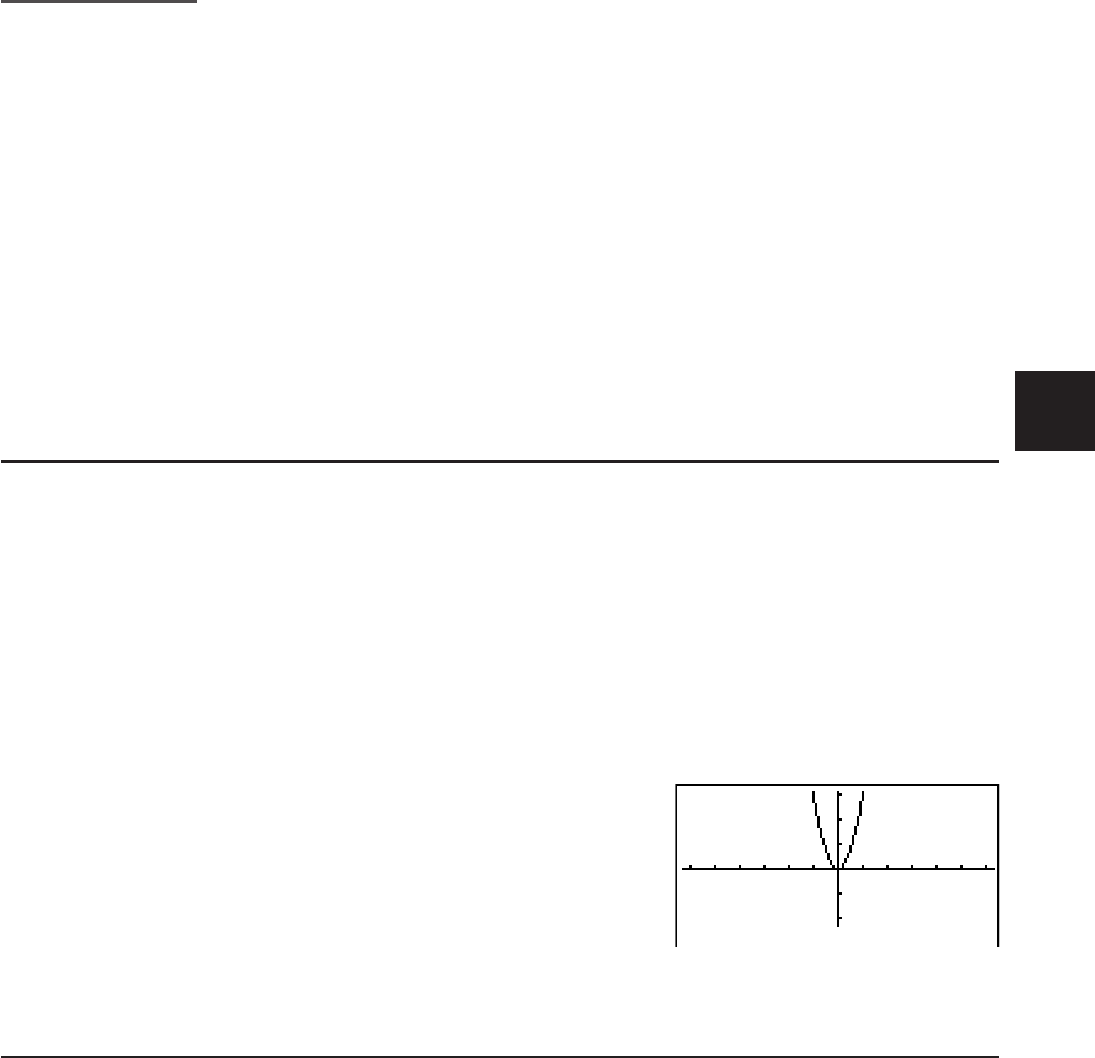
Example To graph
y = 3x
2
K GRAPH
BTVU
(DRAW) (or U)
• Press to return to the screen in step 2 (Graph relation list). After drawing a graph, you
can toggle between the Graph relation list and graph screen by pressing (GjT).
I How to draw a simple graph (2)
You can store up to 20 functions in memory and then select the one you want for graphing.
1. From the Main Menu, enter the GRAPH mode.
2. Specify the function type and input the function whose graph you want to draw.
You can use the GRAPH mode to draw a graph for the following types of expressions:
rectangular coordinate expression (Y=
f(x)), polar coordinate expression, parametric
function, rectangular coordinate expression (X=f(y)), inequality.
(TYPE)(Y=) ... rectangular coordinates (Y=
f(x) type)
(
r=) ... polar coordinates
(Parm) ... parametric function
(X=) ... rectangular coordinates (X=
f(y) type)
5
