


9-17
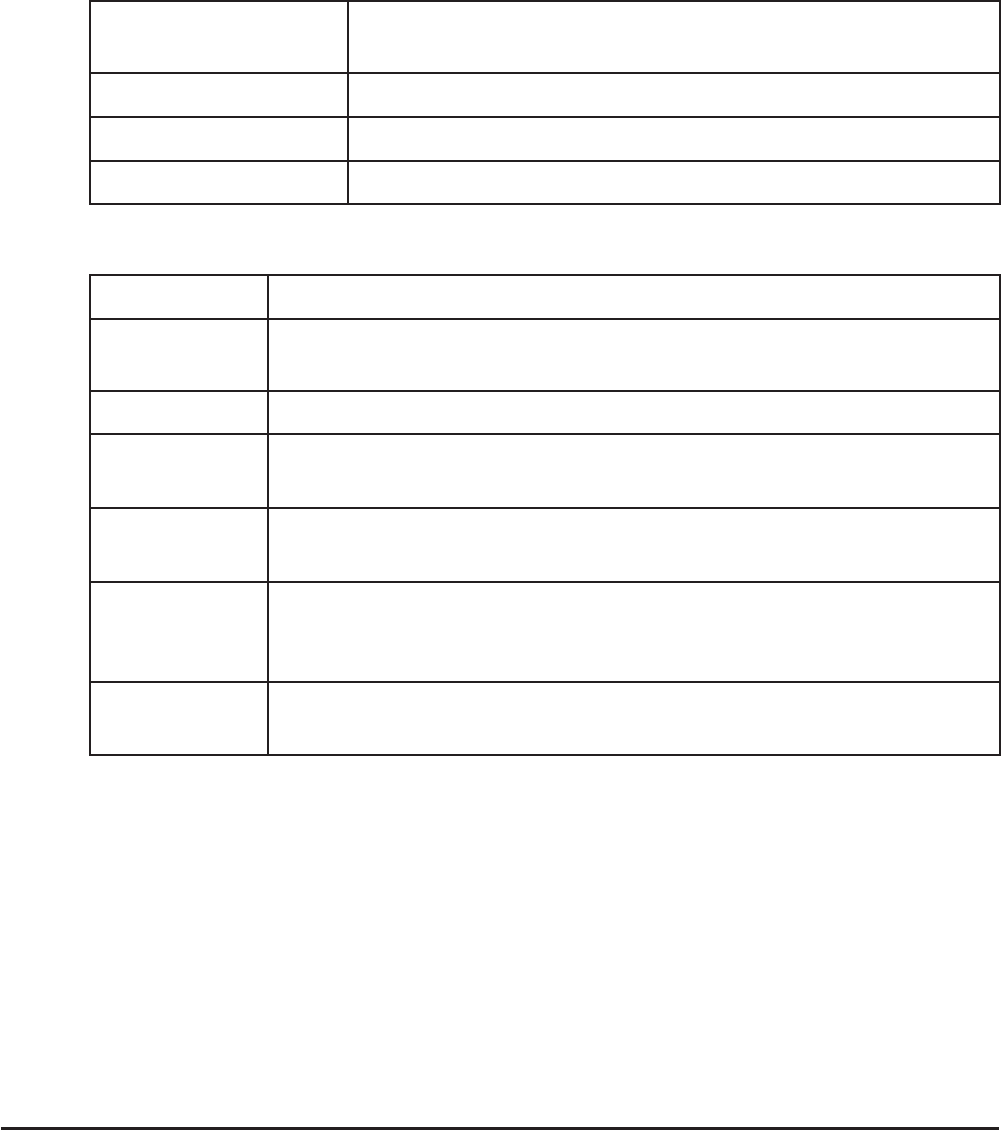
• The number of columns you select in step 1 will determine what information is input
automatically on the general graph settings screen.
If you select this
number of columns:
This information will be input automatically:
1 XCellRange
2 XCellRange, YCellRange
3 XCellRange, YCellRange, Frequency
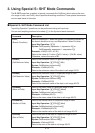
• The following describes each of the setting items for this screen.
Item Description
StatGraph1 Select the name of the setup you want. You can have up to three
different setups registered, named StatGraph 1, 2, or 3.
Graph Type Select the graph type. The initial default setting is Scat (scatter plot).
XCellRange
Specifies the cell range assigned to the graph
x-axis (XCellRange).
Only XCellRange is displayed for some Graph Types.
YCellRange
Specifies the cell range assigned to the graph
y-axis (YCellRange).
The YCellRange is not displayed for some Graph Types.
Frequency Specifies the range cells that contain values indicating the frequency
of each graph data item. Select (1) if you do not want to use
frequency values.
Mark Type
Specify the type of mark (U, s, or •) to use as the mark on the scatter
plot.
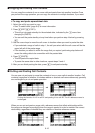
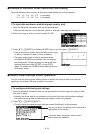
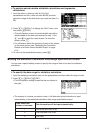
3. Use D and A to move the highlighting to the setting item you want to change. On the
function menu that appears, select the setting you want.
• For details about the StatGraph1, Graph Type, and Mark Type settings, see “To display the
general graph settings screen” (page 6-2).
• If you want to change the XCellRange, YCellRange, or Frequency setting, move the
highlighting to the item you want to change and then input the cell range directly, or select
(CELL) ((CELL) for Frequency) and then edit the currently input range. When
inputting a cell range manually, use (:) to enter a colon (:) between two cells that define
the range.
4. After configuring the required settings, press ) or U.
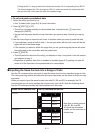
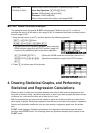
I Example of Statistical Calculation Operation (CALC Menu)
This example uses the data from the “Drawing a Scatter Diagram and xy Line Graph” (page
6-9) to perform paired-variable statistical calculations.
0.5, 1.2, 2.4, 4.0, 5.2 (
x-data)
–2.1, 0.3, 1.5, 2.0, 2.4 (
y-data)