


5-2
(CONV)(Y=) to (Yb)
(E)(
X=) to (Xb) ... changes the function type
(E)(Y>) to (Yb) .... Y inequality on left side
(E)(E)(X>) to (Xb) .... X inequality on left side
Repeat this step as many times as required to input all of the functions you want.
Next you should specify which of the functions among those that are stored in memory
you want to graph (see page 5-6). If you do not select specific functions here, the graph
operation will draw graphs of all the functions currently stored in memory.
3. Draw the graph.
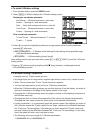
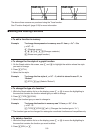
• You can use the function menu that appears when you press (STYL) in step 2 of the
above procedure to select one of the following line styles for each graph.
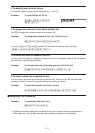
(
) ... Normal (initial default)
(
) … Thick (twice the thickness of Normal)
(
) … Broken (thick broken)
(
) … Dot (dotted)
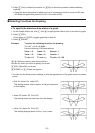
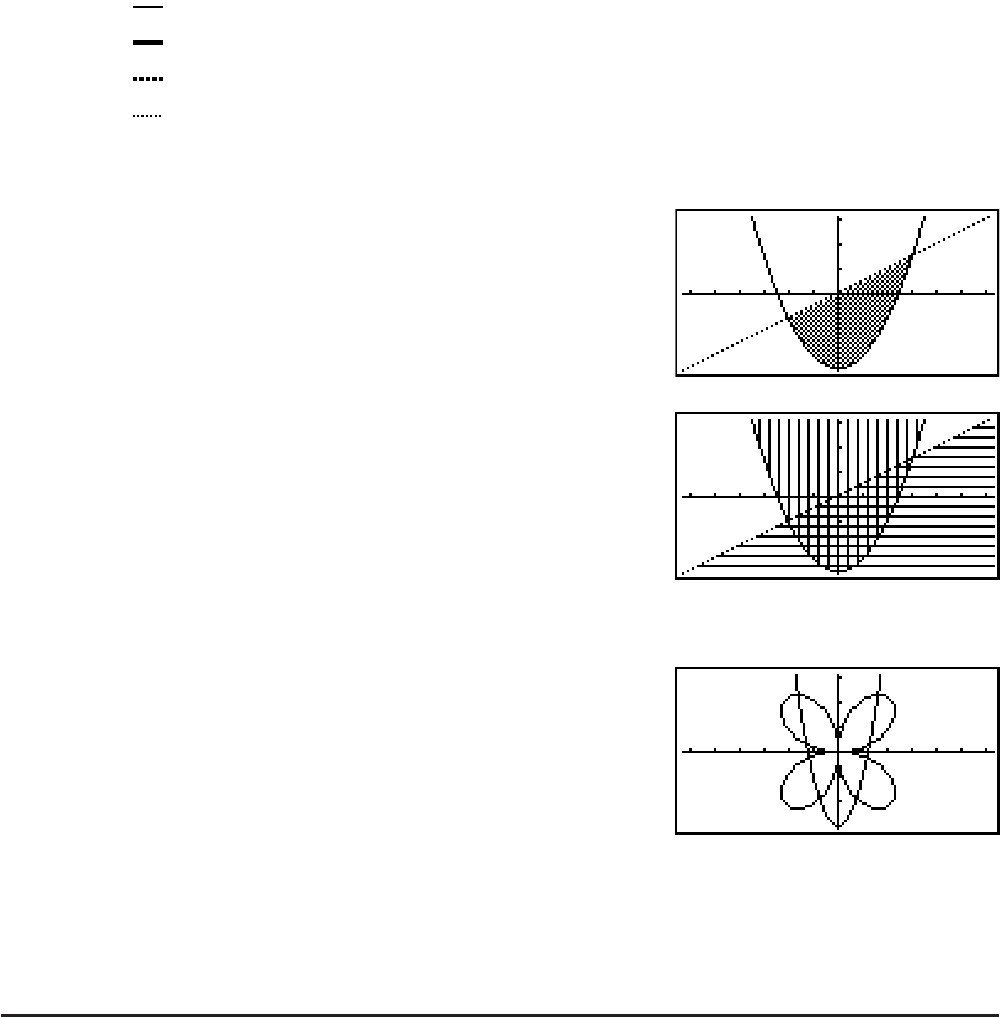
• When simultaneously graphing multiple inequalities, you can use the “Ineq Type” setting
on the Setup screen (K(SETUP)) to specify either of two fill ranges.
(AND) ... Fills areas only where the conditions of
all of the graphed inequalities are satisfied.
This is the initial default.
(OR) ..... Fills all areas where the conditions of the
graphed inequalities are satisfied.
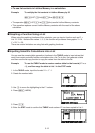
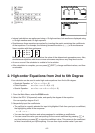
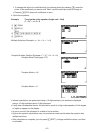
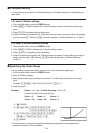
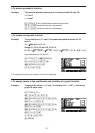
Example Input the functions shown below and draw their graphs.
Y1 = 2
x
2
– 3, r2 = 3sin2
Q
K GRAPH
(TYPE)(Y=)ATVBU
(TYPE)(r=)BQATU
(DRAW)
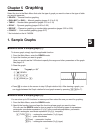
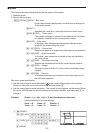
2. Controlling What Appears on a Graph Screen
I V-Window (View Window) Settings
Use the View Window to specify the range of the x- and y-axes, and to set the spacing
between the increments on each axis. You should always set the V-Window parameters you
want to use before graphing.