


5-19
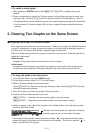
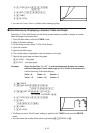
(TYPE)(Y=)BTVAU
TVU
(SET)BUBU@U)
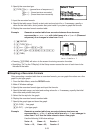
(TABL)
(G
• CON)
• You can use Trace, Zoom, or Sketch after drawing a graph.
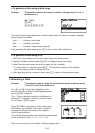
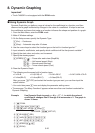
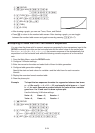
I Simultaneously Displaying a Number Table and Graph
Specifying T+G for Dual Screen on the Setup screen makes it possible to display a number
table and graph at the same time.
1. From the Main Menu, enter the TABLE mode.
2. Make V-Window settings.
3. On the Setup screen, select T+G for Dual Screen.
4. Input the function.
5. Specify the table range.
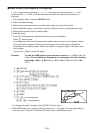
6. The number table is displayed in the sub-screen on the right.
7. Specify the graph type and draw the graph.
(G
• CON) ... line graph
(G
• PLT) ... plot type graph
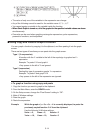
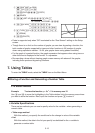
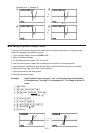
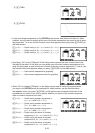
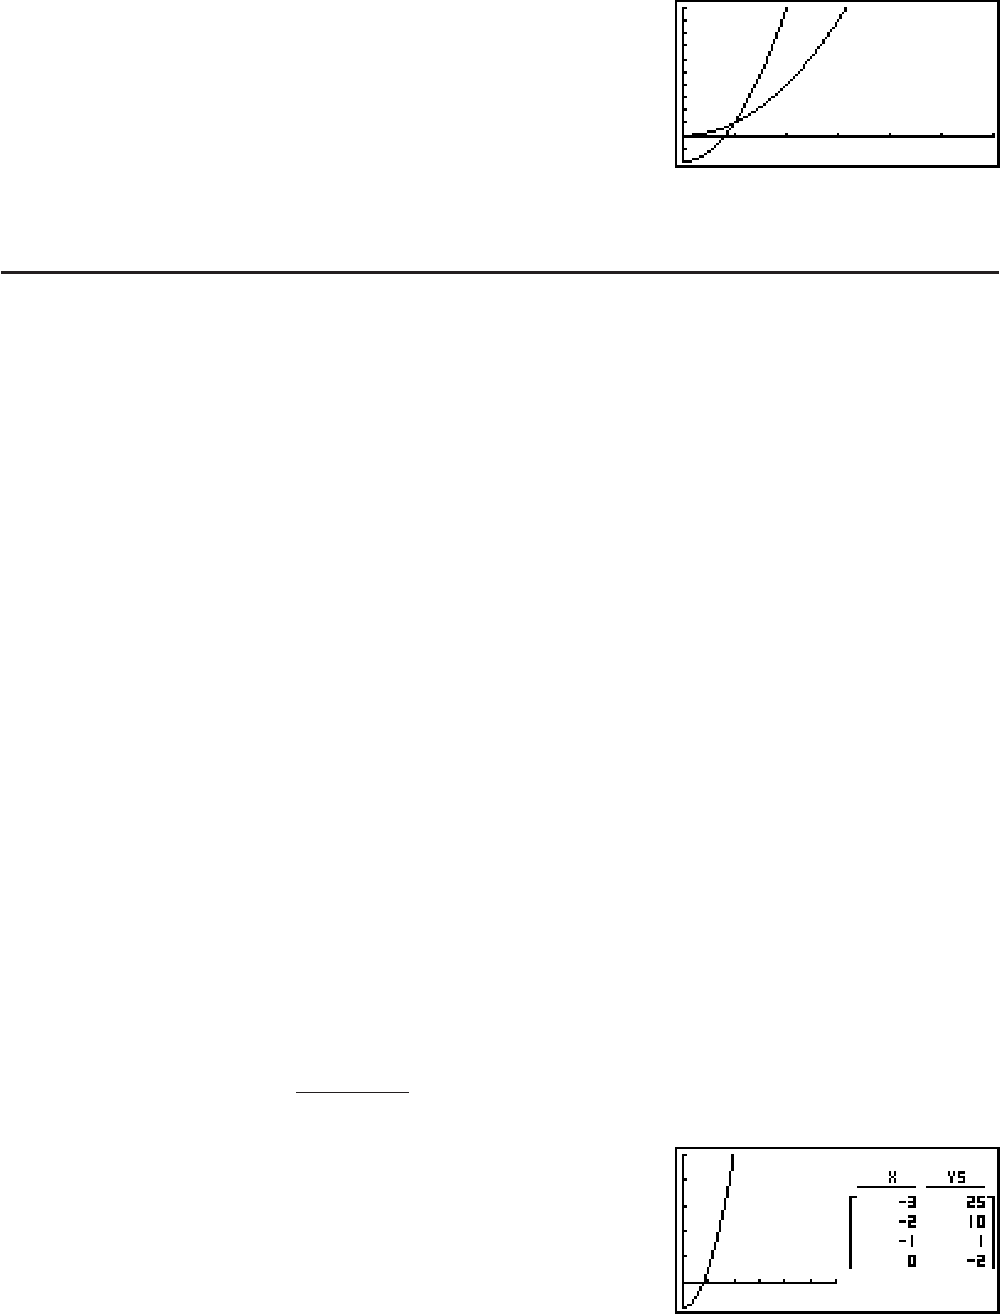
Example Store the function Y1 = 3
x
2
– 2 and simultaneously display its number
table and line graph. Use a table range of –3 to 3 with an increment of 1.
Use the following V-Window settings.
Xmin = 0, Xmax = 6, Xscale = 1
Ymin = –2, Ymax = 10, Yscale = 2
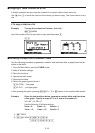
K TABLE
(V-WIN)?UEU@UA
AU@?UAU)
K(SET UP)AAA*(T+G))_
*fx-7400G
ɉ, fx-9750Gɉ: AA
(TYPE)(Y=)BTVAU
(SET)
BUBU@U)
(TABL)
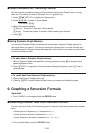
(G • CON)
• The Setup screen’s “Dual Screen” setting is applied in the TABLE mode and the RECUR
mode.
• You can make the number table active by pressing *(CHNG) or .