


20051101
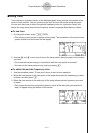
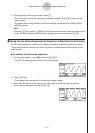
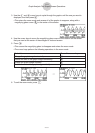
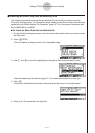
4. After the graph function list settings are configured the way you want, press 6(DRAW).
• This overlays graphs of all the functions for which graphing is turned on, over the graph
that was originally on the graph screen.
11-10
Graph Analysis Tool Graph Screen Operations
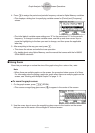
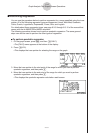
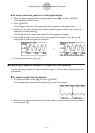
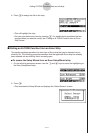
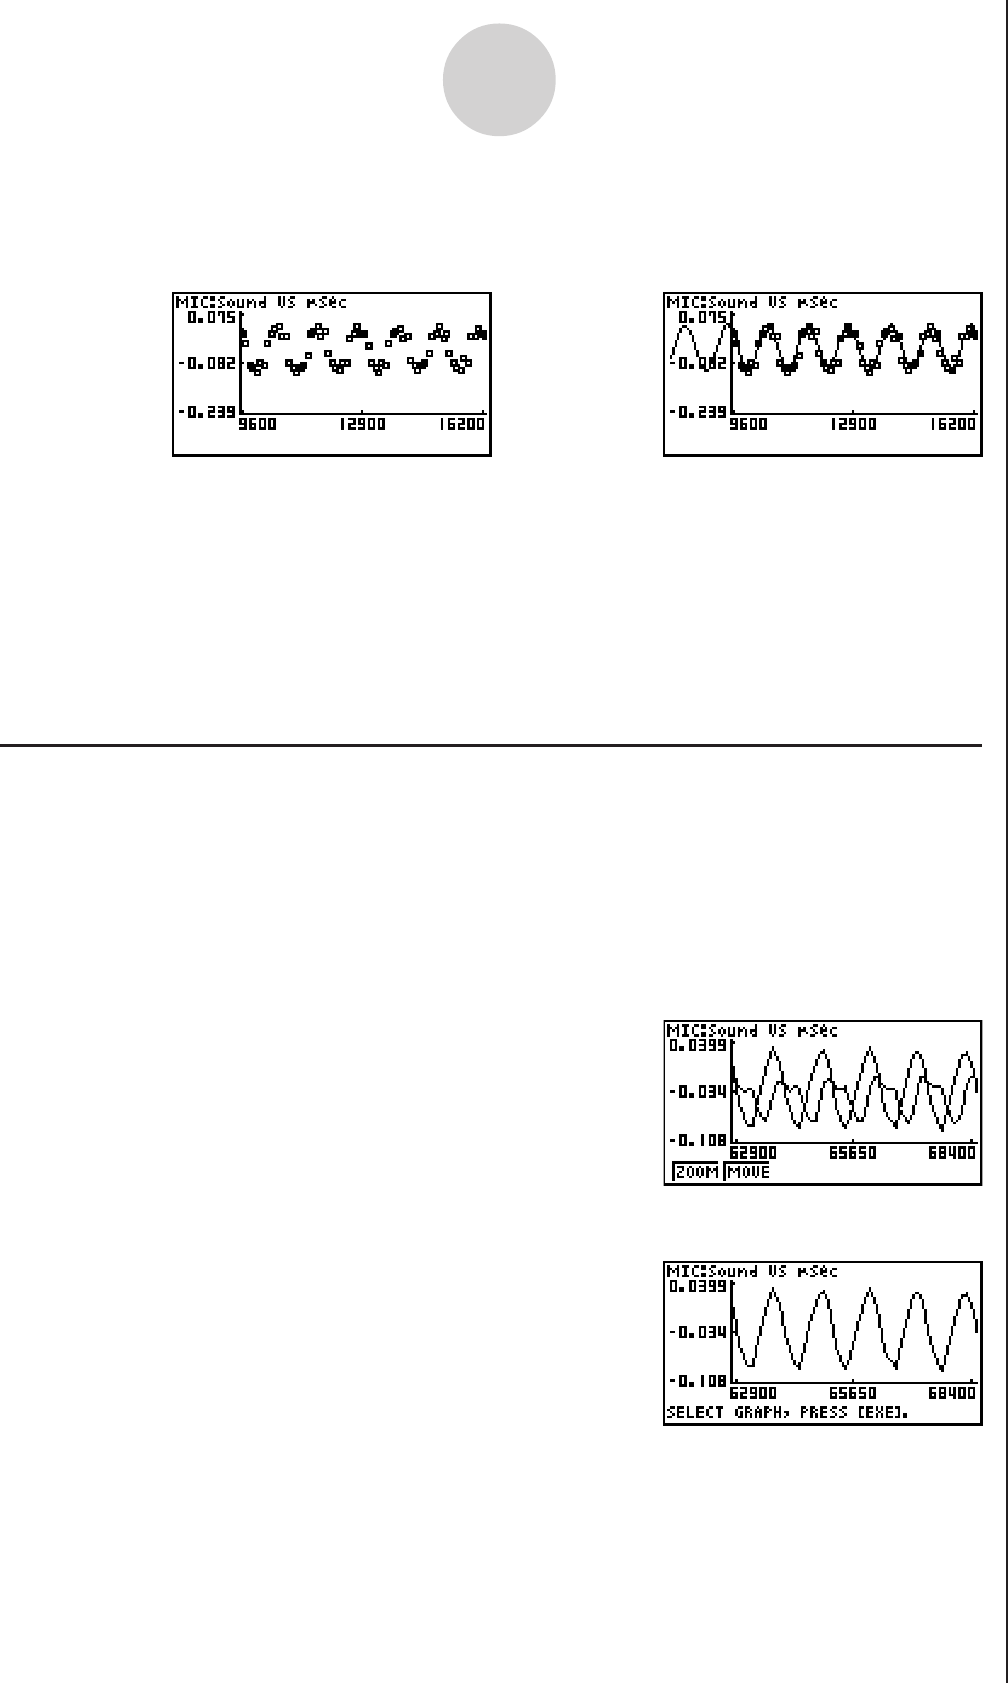
2. Press 1(ZOOM).
• This displays only one of the graphs that were originally on the graph screen.
/
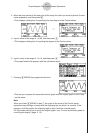
Original Graph Overlaid with Y=f(x) Graph
• To delete the overlaid graph, press !4(SKTCH) and then 1(Cls).
Important!
• The screenshot shown in step 4 above is of a function that was calculated and stored by
performing regression on a graph that was drawn using sampled data. Note that
overlaying a Y=f(x) graph on a sampled data graph does not automatically draw a
regression graph based on sampled data.
k Working with Multiple Graphs
The procedures in this section explain how you can zoom or move a particular graph when
there are multiple graphs on the display.
uu
uu
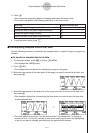
u To zoom a particular graph on a multi-graph display
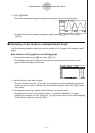
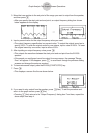
1. When the graph screen contains multiple graphs, press K, and then 3(EDIT).
• The [EDIT] menu appears at the bottom of the display.