


5-27
10. Graphing a Conic Section
Important!
• The fx-7400Gɉ is not equipped with the CONICS mode.
I Graphing a Conic Section
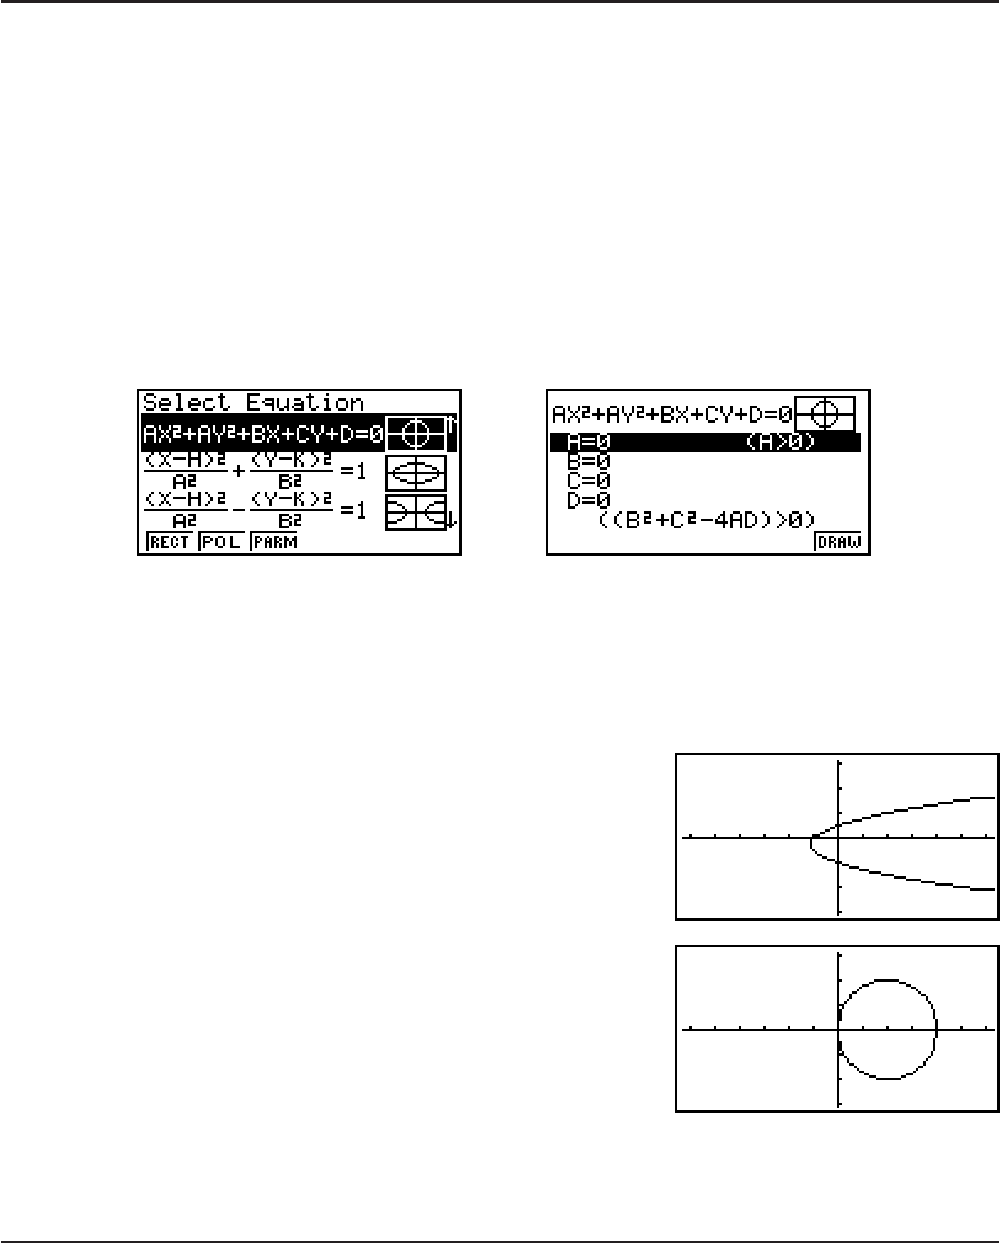
You can use the CONICS mode to graph parabolas, circles, ellipses, and hyperbolas. You can
input a rectangular coordinate function, polar coordinate function, or parametric function for
graphing.
1. From the Main Menu, enter the CONICS mode.
2. Select the function type.
(RECT).... {rectangular coordinate}
(POL).... {polar coordinate}
(PARM).... {parametric}
3. Select the pattern of the function in accordance with the type of graph you want to draw.
1
U
4. Enter the coefficients of the function and draw the graph.
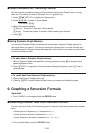
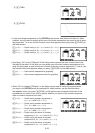
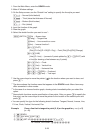
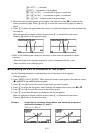
Example To input the rectangular coordinate function
x = 2y
2
+ y − 1 and graph a
parabola open on the right, and then input the polar coordinate function
r = 4cos
Q
and draw a circle graph.
KCONICS
(RECT)A(X=AY
2
+BY+C)U
AU@U@U(DRAW)
))
(POL)AAAA(R=2Acos
Q
)U
AU(DRAW)
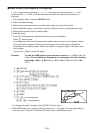
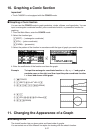
11. Changing the Appearance of a Graph
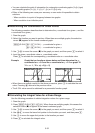
I Drawing a Line
The sketch function lets you draw points and lines inside of graphs.
You can select one of four different line styles for drawing with the sketch function.