


9-19
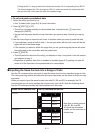
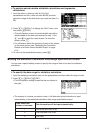
• The following describes each of the setting items for this screen.
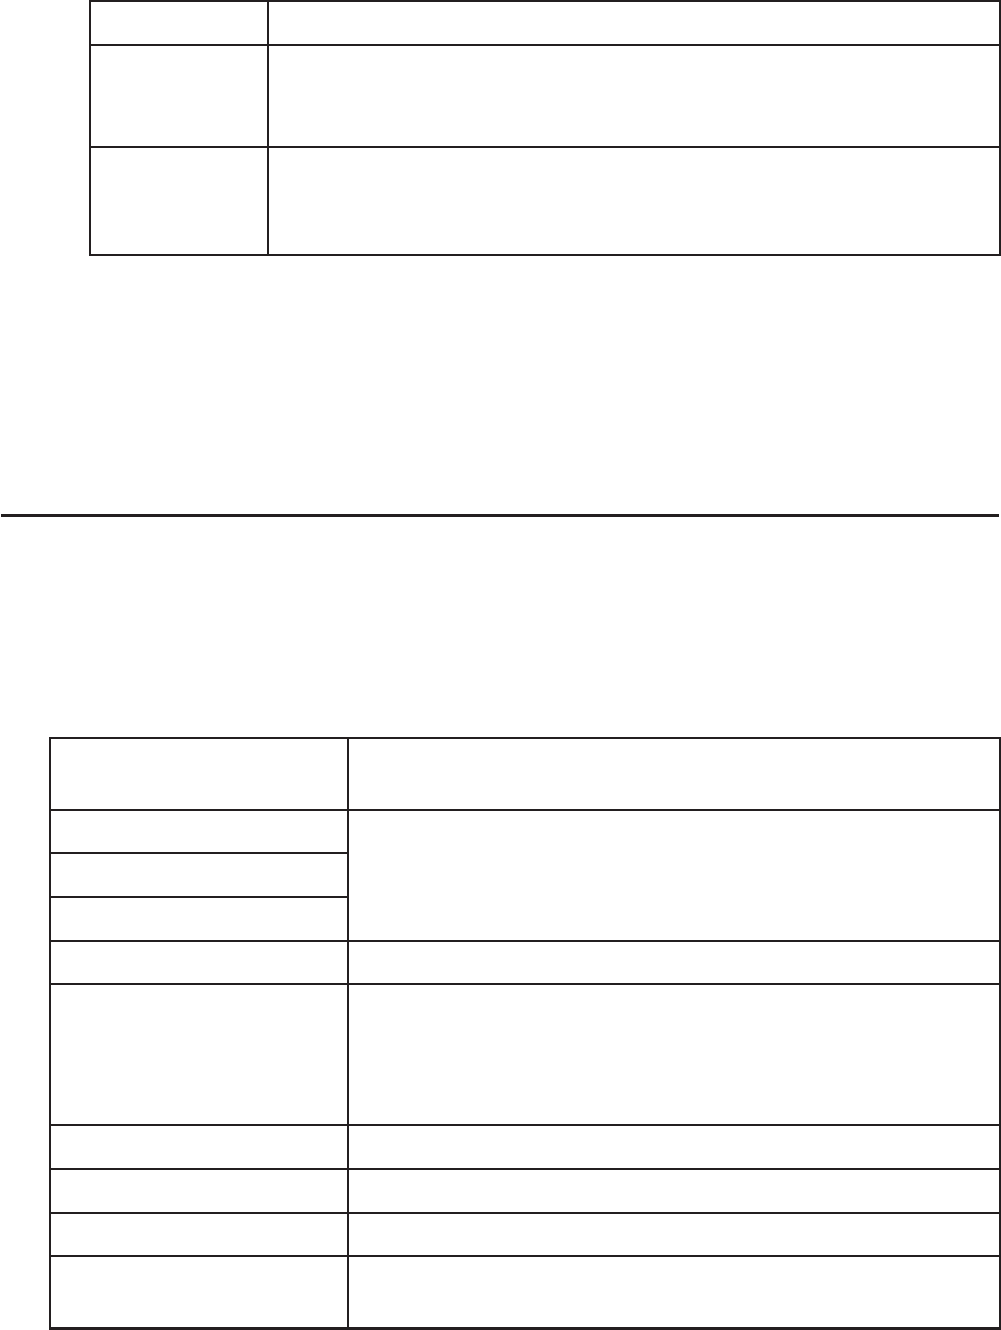
Item Description
1Var XCell
1Var Freq
The cell range data specified here is used for variable
x and
Frequency values when performing single-variable statistical
calculations.
2Var XCell
2Var YCell
2Var Freq
The cell range data specified here is used for variable
x, variable y,
and Frequency values when performing paired-variable statistical
calculations.
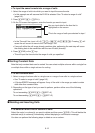
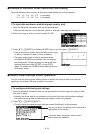
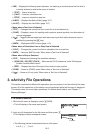
3. If you want to change the cell range, use D and A to move the highlighting to the item
you want to change and the input the new cell range.
• To input the colon (:), press (:).
• To edit the currently input cell range, press (CELL) (in the case of 1Var XCell, 2Var
XCell, and 2Var YCell) or (CELL) (in the case of 1Var Freq and 2Var Freq).
4. After configuring the required settings, press ) or U.
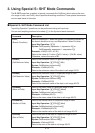
I STAT Mode and S
•
SHT Mode Function Menu Correspondence Table
In both the STAT mode and the S
•
SHT mode, statistical graph functions are on the GRPH
function menu and statistical/regression calculation functions are on the CALC function menu.
The structures of these menus and their submenus are the same in the STAT mode and the
S
•
SHT mode. For details about each menu item, refer to the pages referenced in the table
below.
For information about
this menu item:
Refer to:
{GRPH} - {GPH1} “Changing Graph Parameters” (page 6-1)
{GRPH} - {GPH2}
{GRPH} - {GPH3}
{GRPH} - {SEL} “Graph draw/non-draw status” (page 6-3)
{GRPH} - {SET} “Changing Graph Parameters” (page 6-1)
“General graph settings”(page 6-1)
“To display the general graph settings screen”(page 6-2)
“General Graph Settings Screen Operations” (page 9-16)
{CALC} - {1VAR} “Single-Variable Statistical Calculations” (page 6-15)
{CALC} - {2VAR} “Paired-Variable Statistical Calculations” (page 6-15)
{CALC} - {REG} “Regression Calculation” (page 6-16)
{CALC} - {SET} “Using the Statistical Calculation Data Range Specification
Screen” (page 9-18)