


20051101
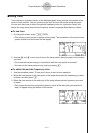
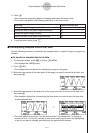
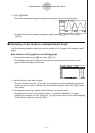
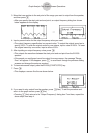
5. Press 6(DRAW).
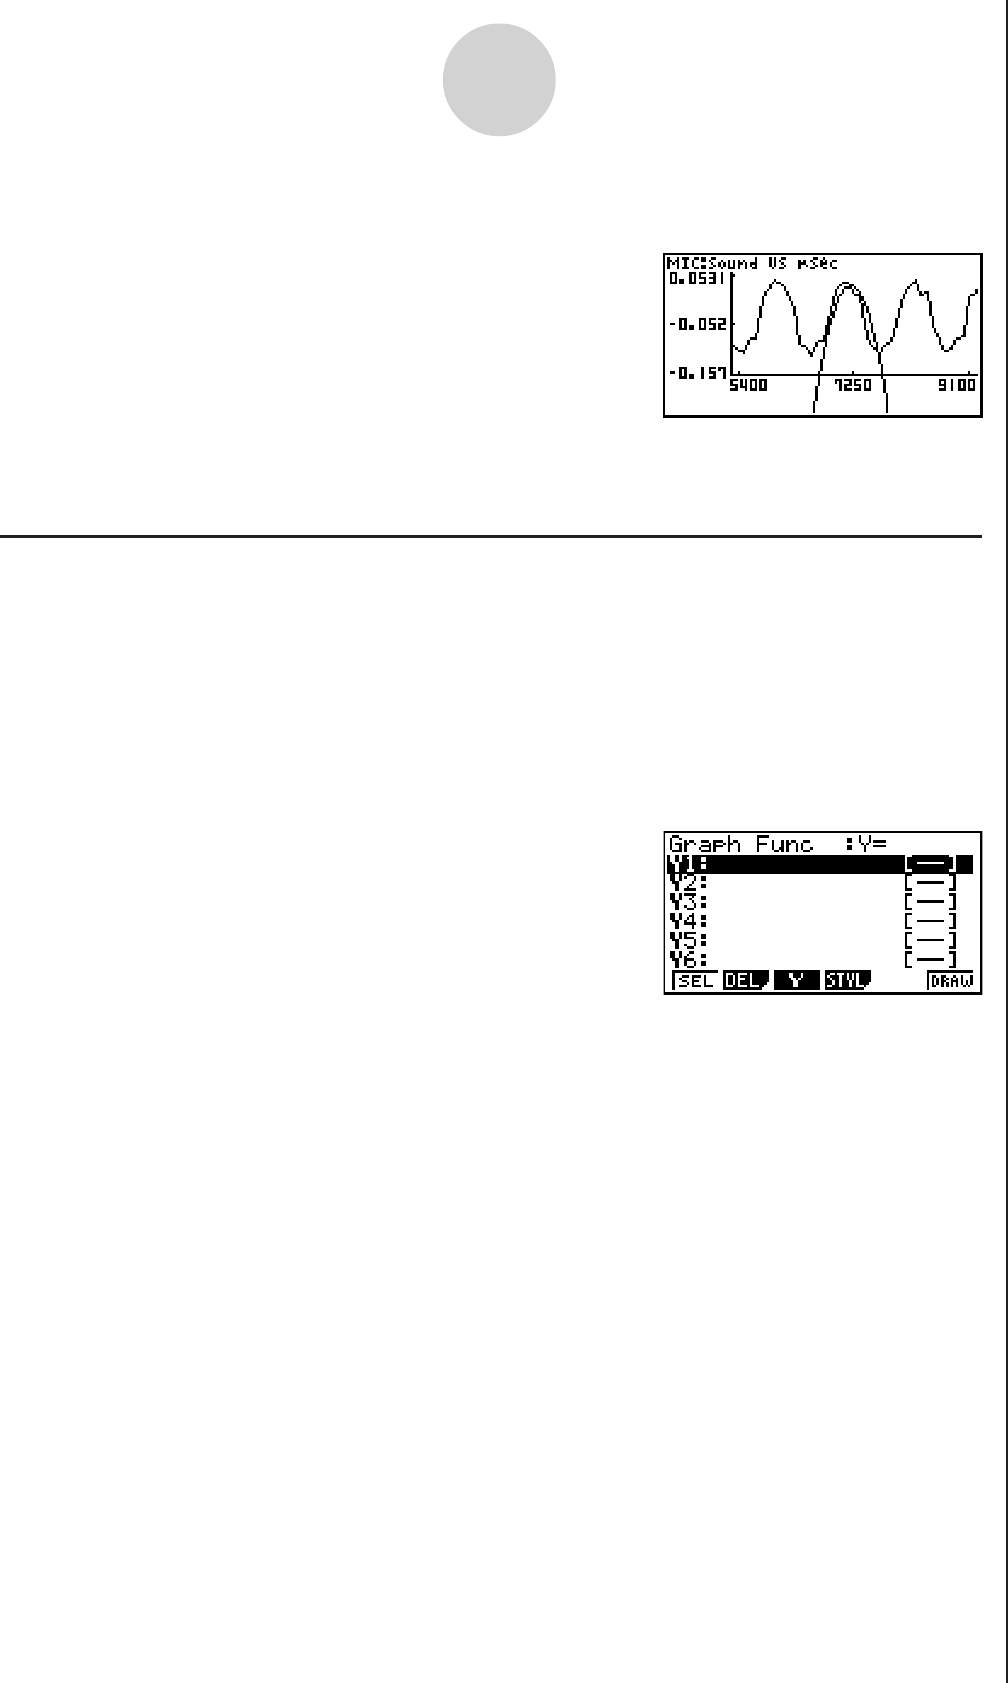
• This draws a quadratic regression graph and overlays it over the original graph.
• To delete the overlaid quadratic regression graph, press !4(SKTCH) and then
1(Cls).
k Overlaying a Y=f(x) Graph on a Sampled Result Graph
Use the following procedure when you want to overlay a Y=f(x) graph on the sampled result
graph.
uu
uu
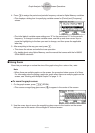
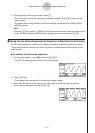
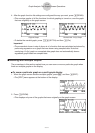
u To overlay a Y=f(x) graph on an existing graph
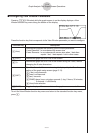
1. On the graph screen, press K, and then 5(Y=fx).
• This displays the graph function list. Any functions you have previously input on the
graph function list appear at this time.
11-9
Graph Analysis Tool Graph Screen Operations
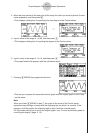
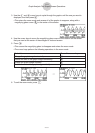
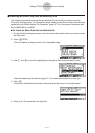
2. Input the function you want to graph.
• To input a function, use the f and c cursor keys to move the highlighting to the line
where you want to input it, and then use the calculator keys for input. Press w to store
the function.
3. On the graph function list, specify which functions you want to graph.
• Graphing is turned on for any function whose “=” symbol is highlighted. To toggle
graphing of a function on or off, use the f and c cursor keys to move the highlighting
to the function, and then press 1(SEL).