


20051101
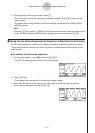
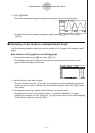
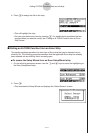
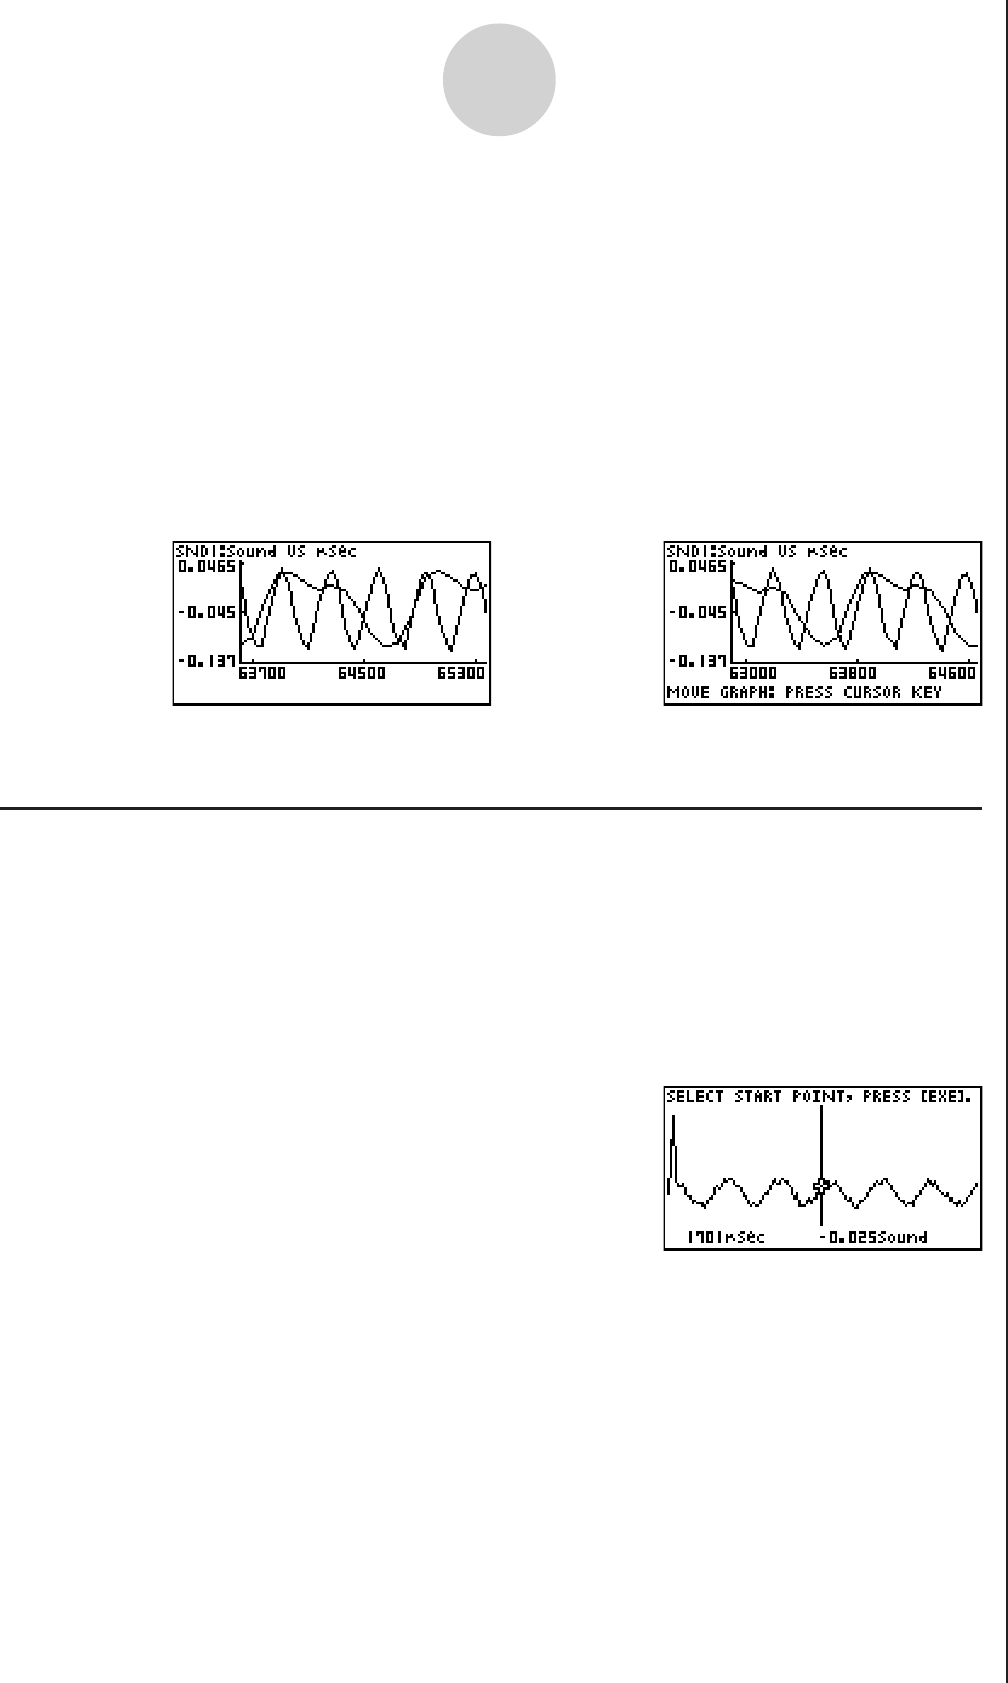
2. Move the trace pointer to the start point of the range you want to output from the speaker,
and then press w.
11-12
Graph Analysis Tool Graph Screen Operations
/
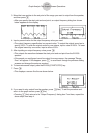
5. To exit the move mode, press J.
k Outputting a Specific Range of a Graph from the Speaker
Use the following procedure to output a specific range of a sound data waveform graph from
the speaker.
uu
uu
u
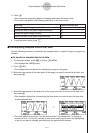
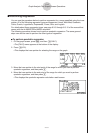
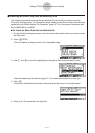
To output a graph from the speaker
1. On the graph screen, press K, and then 4(SPKR).
• This displays the trace pointer for selecting the range on the graph.
uu
uu
u
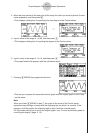
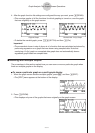
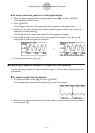
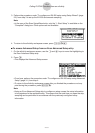
To move a particular graph on a multi-graph display
1. When the graph screen contains multiple graphs, press K, and then 3(EDIT).
• This displays the [EDIT] menu.
2. Press 2(MOVE).
• This displays only one of the graphs that were originally on the graph screen.
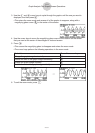
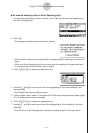
3. Use the f and c cursor keys to cycle through the graphs until the one you want is
displayed, and then press w.
• This enters the move mode and causes all of the graphs to reappear.
4. Use the d and e cursor keys to move the graph left and right, or the f and c
cursor keys to move the graph up and down.