


13-8
Cisco ONS 15454 SDH Reference Manual, R5.0
April 2008
Chapter 13 Alarm Monitoring and Management
13.4.7 Viewing History
13.4.6.2 Conditions Column Descriptions
Table 13-6 lists the Conditions window column headings and the information recorded in each column.
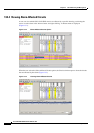
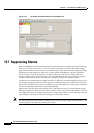
13.4.6.3 Filtering Conditions
The condition display can be filtered to prevent display of conditions (including alarms) with certain
severities or that occurred between certain dates. You can set the filtering parameters by clicking the
Filter button at the bottom-left of the Conditions window. You can turn the filter on or off by clicking
the Filter tool at the bottom-right of the window. CTC retains your filter activation setting. For example,
if you turn the filter on and then log out, CTC keeps the filter active the next time you log in.
13.4.7 Viewing History
The History window displays historic alarm or condition data for the node or for your login session. You
can chose to display only alarm history, only events, or both by checking check boxes in the History >
Node window. You can view network-level alarm and condition history, such as for circuits, at that level.
At the node level, you can see all port (facility), card, STS, and system-level history entries. For example,
protection-switching events or performance-monitoring threshold crossings appear here. If you
double-click a card, you can view all port, card, and STS alarm or condition history that directly affects
the card.
The ONS 15454 SDH can store up to 640 Critical alarm messages, 640 Major alarm messages, 640
Minor alarm messages, and 640 condition messages. When any of these limits is reached, the
ONS 15454 SDH discards the oldest events in that category.
Table 13-6 Conditions Column Description
Column Information Recorded
New Indicates a new condition.
Date Date and time of the condition.
Object The object for an HPmon or LPmon.
Eqpt Type Card type in this slot.
Slot Slot where the condition occurred (appears only in network and node view).
Port Port where the alarm is raised. For HPTerm and LPTerm, the port refers to the upstream
card it is partnered with.
Sev
1
1. All alarms, their severities, and service-affecting statuses are also displayed in the Condition tab unless you choose to filter
the alarm from the display using the Filter button.
Severity level: CR (Critical), MJ (Major), MN (Minor), NA (Not Alarmed), NR
(Not Reported).
SA
1
Indicates a service-affecting alarm (when checked).
Cond The error message/alarm name; these names are alphabetically defined in the “Alarm
Troubleshooting” chapter of the Cisco ONS 15454 SDH Troubleshooting Guide.
Description Description of the condition.
Node Node where the alarm occurred (appears only in network view).