


370 Viewing Statistics
www.dell.com | support.dell.com
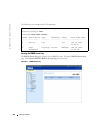
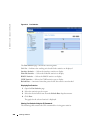
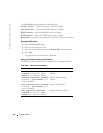
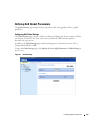
The
LAG Statistics
page contains the following fields:
Interface Statistics
— Selects the interface statistics to display.
Etherlike Statistics
— Selects the Etherlike statistics to display.
RMON Statistics
— Selects the RMON statistics to display.
GVRP Statistics
— Selects the GVRP statistics type to display.
Refresh Rate
— Amount of time that passes before the statistics are refreshed.
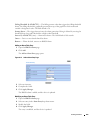
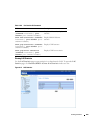
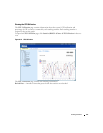
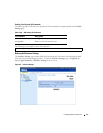
Displaying LAG Statistics
1
Open the
LAG Statistics
page.
2
Select the statistic type to open.
3
Select the desired refresh rate from the
Refresh Rate
drop-down menu.
4
Click
Draw
.
The graph for the selected statistic is displayed.
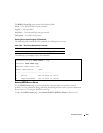
Viewing LAG Statistics Using the CLI Commands
The following table contains the CLI commands for viewing LAG statistics.
Table 8-106. LAG Statistic CLI Commands
CLI Command Description
show interfaces counters
[ethernet
interface
| port-
channel
port-channel-number
]
Displays traffic seen by the physical
interface.
show rmon statistics {ethernet
interface
| port-channel
port-
channel-number
}
Displays RMON Ethernet
statistics.
show gvrp statistics {ethernet
interface
| port-channel
port-
channel-number
}
Displays GVRP statistics.
show gvrp-error statistics
{ethernet
interface
| port-
channel
port-channel-number
}
Displays GVRP error statistics.